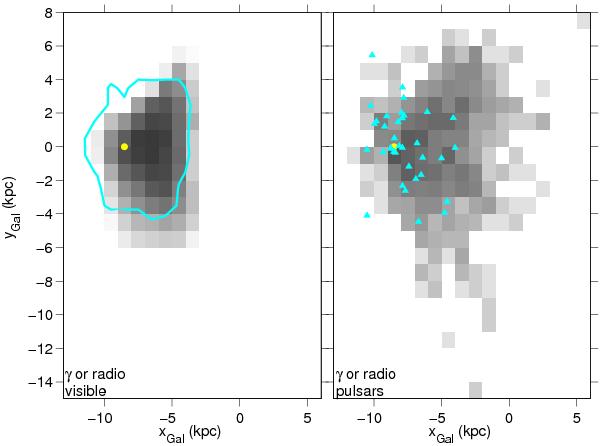
Fig. 12

Number density of the visible radio and/or γ-ray pulsars in the Milky Way (polar view). The left and right plots respectively show the simulation and observed data with the same logarithmic gray scale saturating at 100 star/bin and the same visibility criteria. The cyan contour outlines the region where simulated SG γ-ray pulsars are detectable. The cyan triangles show the location of the LAT pulsars. The yellow dot marks the Sun.
Current usage metrics show cumulative count of Article Views (full-text article views including HTML views, PDF and ePub downloads, according to the available data) and Abstracts Views on Vision4Press platform.
Data correspond to usage on the plateform after 2015. The current usage metrics is available 48-96 hours after online publication and is updated daily on week days.
Initial download of the metrics may take a while.


