Fig. A.2
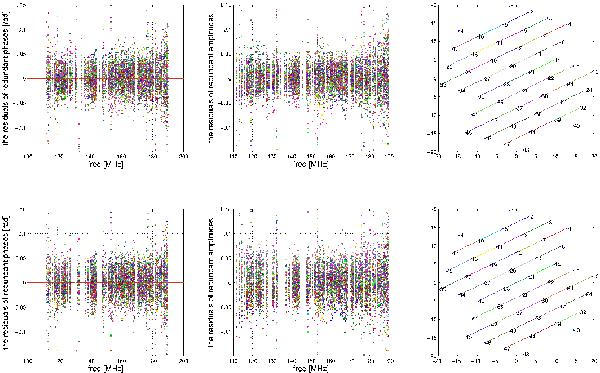
Plots of the residuals for corrected redundant visibilities in terms of phases and amplitudes on a given set of redundant baselines. The first row shows the results after redundancy calibration. The second row shows the result afters model-based calibration. The data is taken from the observation done on 24 November 2009 at 15:25:43 UTC, when CasA was at low elevation. The station configuration of RS208 is shown in the rightmost panel. The corresponding redundant baselines to each redundant visibility are also depicted on the station layout, with the same color code.
Current usage metrics show cumulative count of Article Views (full-text article views including HTML views, PDF and ePub downloads, according to the available data) and Abstracts Views on Vision4Press platform.
Data correspond to usage on the plateform after 2015. The current usage metrics is available 48-96 hours after online publication and is updated daily on week days.
Initial download of the metrics may take a while.