Fig. 8
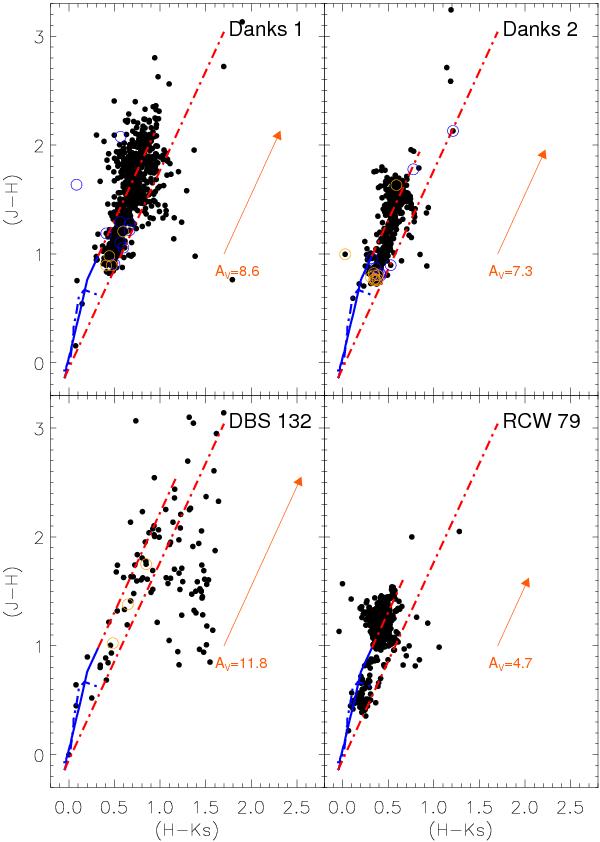
(J − H) vs. (H − Ks) colour − colour diagram. The continuous lines represents the sequence of the zero-reddening stars of luminosity class I and class V (Koornneef 1983). The reddening vector is overplotted and the dotted lines are parallel to the standard reddening vector. O and B stars are marked with blue and orange circles, respectively.
Current usage metrics show cumulative count of Article Views (full-text article views including HTML views, PDF and ePub downloads, according to the available data) and Abstracts Views on Vision4Press platform.
Data correspond to usage on the plateform after 2015. The current usage metrics is available 48-96 hours after online publication and is updated daily on week days.
Initial download of the metrics may take a while.