Fig. 6
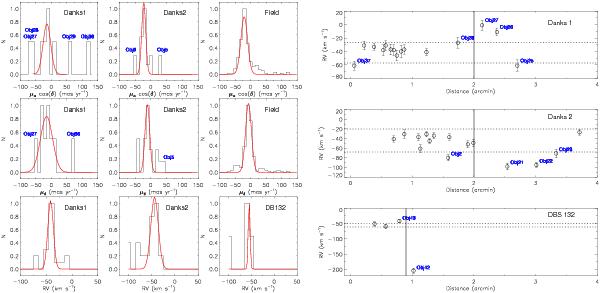
Left: top and middle panel: histograms and proper motion distributions of μαcosδ and μδ of Danks 1, Danks 2 and comparison field. Left: bottom panel: RV distributions of Danks 1, Danks 2 and DB132. The solid lines represent the best Gaussian fit, outliers are labelled. Right: radial velocities for our spectroscopic targets as a function of distance from the Danks 1 (top), Danks 2 (middle) and DBS 132 (bottom) cluster centres. The horizontal lines represent the dispersion of the Gaussian fit (see text). The adopted cluster diameter is shown by the vertical line. The error bars represent the random error in determining the RV for each star.
Current usage metrics show cumulative count of Article Views (full-text article views including HTML views, PDF and ePub downloads, according to the available data) and Abstracts Views on Vision4Press platform.
Data correspond to usage on the plateform after 2015. The current usage metrics is available 48-96 hours after online publication and is updated daily on week days.
Initial download of the metrics may take a while.