Fig. 11
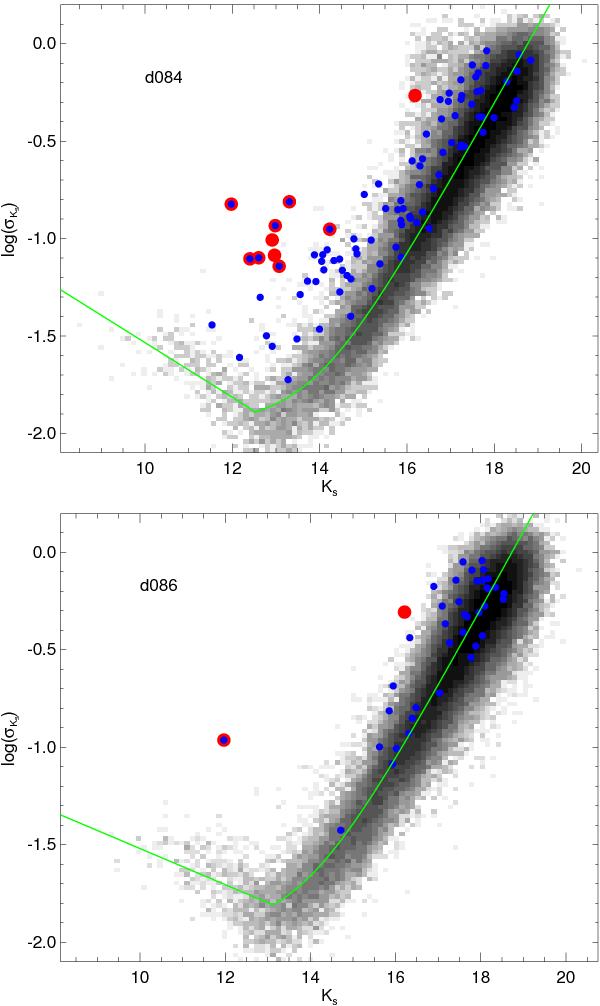
Standard deviation (σKs) of the Ks-band light-curve extracted from the VVV fields d084 and d086. The fit of a theoretical relation between the Ks and the photometric accuracy is plotted in solid, green line. The variable candidates among the stars in the radius of the four studied clusters are shown. Big, red circles are stars having a variability amplitude higher than 5σKs, while small, blue circles are stars with σKs/σi ≥ 2.5, where σi is the internal scatter of the time-series.
Current usage metrics show cumulative count of Article Views (full-text article views including HTML views, PDF and ePub downloads, according to the available data) and Abstracts Views on Vision4Press platform.
Data correspond to usage on the plateform after 2015. The current usage metrics is available 48-96 hours after online publication and is updated daily on week days.
Initial download of the metrics may take a while.