Free Access
Fig. 7
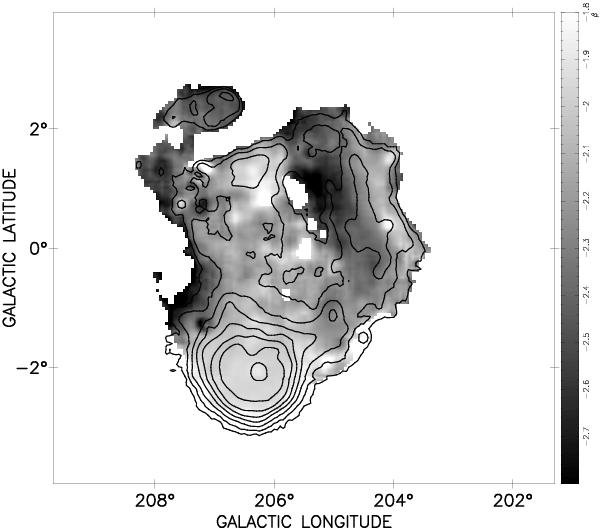
Temperature spectral index map of the Monoceros SNR from 21/11/6 cm maps. Regions where the random error exceeds 0.06 have been blanked out. Contours of 6 cm total intensity with the same levels as Fig. 2 are overlaid.
Current usage metrics show cumulative count of Article Views (full-text article views including HTML views, PDF and ePub downloads, according to the available data) and Abstracts Views on Vision4Press platform.
Data correspond to usage on the plateform after 2015. The current usage metrics is available 48-96 hours after online publication and is updated daily on week days.
Initial download of the metrics may take a while.