Fig. 8
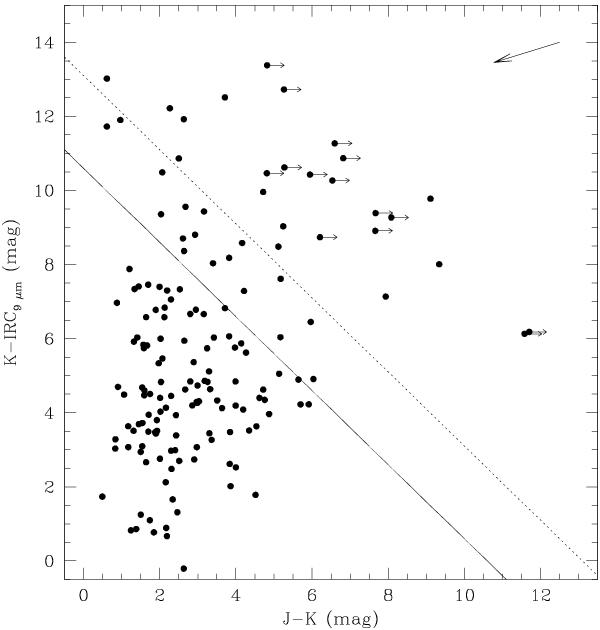
Infrared color–color diagram for the post-AGB star and PN candidates in our sample. Sources above the dotted (solid) line have a F9 μm/FJ ratio larger than 1000 (100). The long arrow at the top right corner represents the shift in the position of a source on this plane after correcting it from a Galactic interstellar absorption of AV = 10 mag The horizontal small arrows associated to some of the sources indicate that they are not detected in the J band and thus their location can still be shifted towards the right.
Current usage metrics show cumulative count of Article Views (full-text article views including HTML views, PDF and ePub downloads, according to the available data) and Abstracts Views on Vision4Press platform.
Data correspond to usage on the plateform after 2015. The current usage metrics is available 48-96 hours after online publication and is updated daily on week days.
Initial download of the metrics may take a while.