Fig. 6
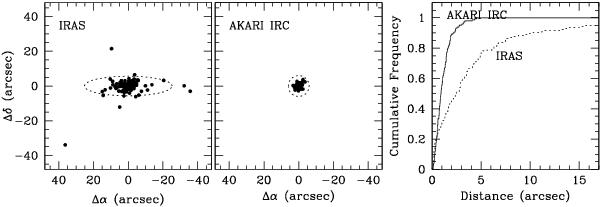
Angular distance between the IRAS (left) and AKARI IRC (center) coordinates and the new near-IR coordinates derived in this work. The dashed figures corresponds to the median IRAS error ellipse and AKARI IRC positional uncertainty of the sources in our sample. (Right) Cumulative frequency of the distribution of the angular distance between the IRAS (dotted histogram) and AKARI IRC (solid histogram) coordinates and the new near-IR coordinates derived in this work.
Current usage metrics show cumulative count of Article Views (full-text article views including HTML views, PDF and ePub downloads, according to the available data) and Abstracts Views on Vision4Press platform.
Data correspond to usage on the plateform after 2015. The current usage metrics is available 48-96 hours after online publication and is updated daily on week days.
Initial download of the metrics may take a while.