Fig. 4
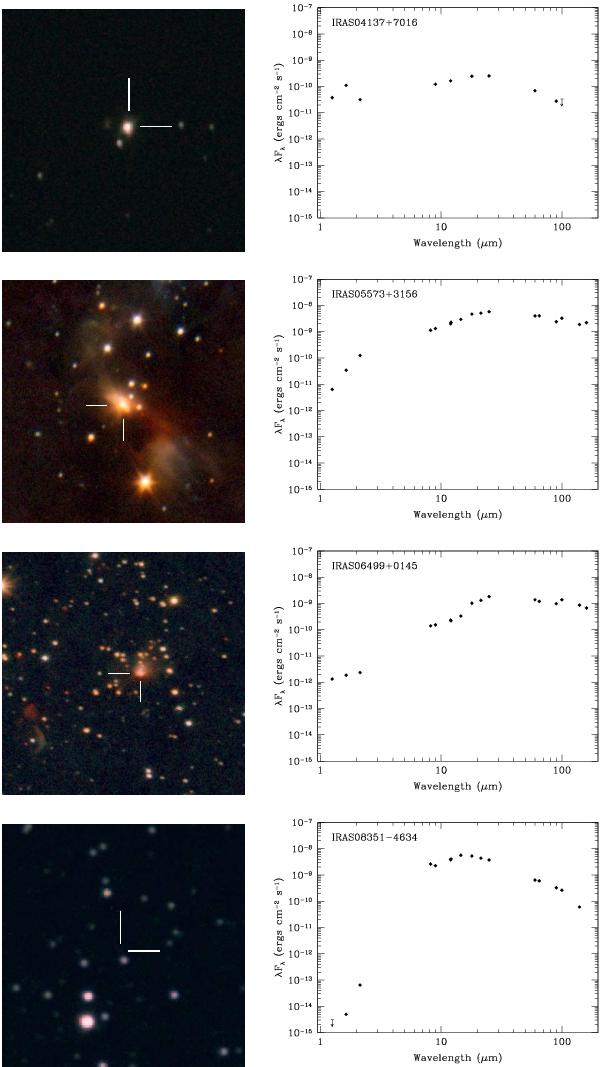
(Left) TNG and NTT J (blue), H (green), and KS (red) composite pictures and (right) IR spectral energy distributions (SEDs) of the IRAS post-AGB star and PN candidates. In the pictures, north is up, east to the left. The field of view is 1′, but for IRAS 05573 + 3156 and IRAS 06499 + 0145 which is 1 5. The SEDs are built using our JHK photometric measurements and data extracted from the Spitzer GLIMPSE, MSX, AKARI, and IRAS catalogs. The arrows at J, H, K, or 100 μm represent flux upper limits (in the case of 100 μm, IRAS quality-factor, FQUAL, equals to 1).
Current usage metrics show cumulative count of Article Views (full-text article views including HTML views, PDF and ePub downloads, according to the available data) and Abstracts Views on Vision4Press platform.
Data correspond to usage on the plateform after 2015. The current usage metrics is available 48-96 hours after online publication and is updated daily on week days.
Initial download of the metrics may take a while.