Free Access
Fig. 9
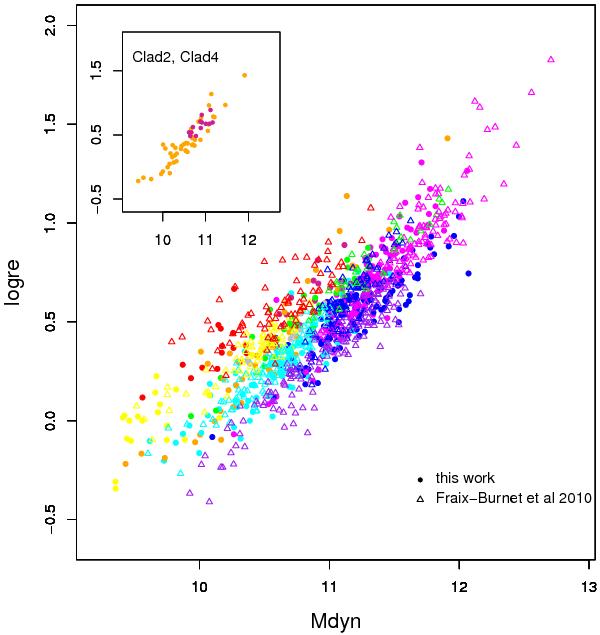
Comparison between the partitioning obtained by cladistics and that of Fraix-Burnet et al. (2010). In the inset, we plot the groups Clad2 and Clad4, which are difficult to see in the main graph. See also Fig. C.4.
Current usage metrics show cumulative count of Article Views (full-text article views including HTML views, PDF and ePub downloads, according to the available data) and Abstracts Views on Vision4Press platform.
Data correspond to usage on the plateform after 2015. The current usage metrics is available 48-96 hours after online publication and is updated daily on week days.
Initial download of the metrics may take a while.