Fig. 6
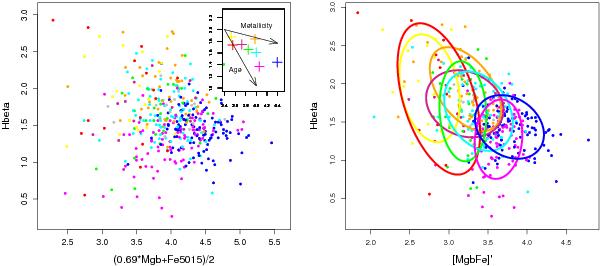
Left: equivalent of Fig. 9 by Thomas et al. (2011) or Figs. 3 and 8 by Kuntschner et al. (2010). The inset shows the median for each group and the arrows indicating the direction of increase of age and metallicity from single stellar population evolutionary models as shown by these authors. Right: group inertia ellipses for the Hβ vs. [MgbFe]′ scatter plot.
Current usage metrics show cumulative count of Article Views (full-text article views including HTML views, PDF and ePub downloads, according to the available data) and Abstracts Views on Vision4Press platform.
Data correspond to usage on the plateform after 2015. The current usage metrics is available 48-96 hours after online publication and is updated daily on week days.
Initial download of the metrics may take a while.