Fig. 2
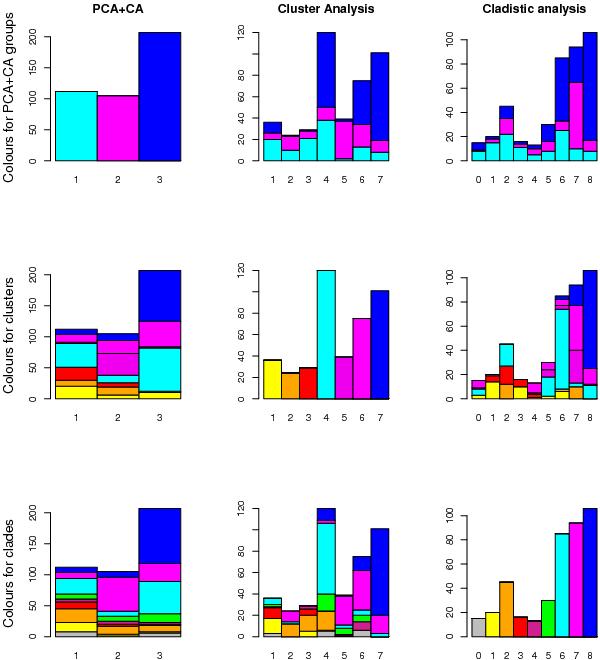
Comparison of analyses with three different methods: PCA+CA (left panels), cluster analysis (middle panels), and cladistics (right panels). The MCA result is not shown since it can be easily compared to the cladistic result (see Sect. 4.5). In the first row, the colours identify the eight groups found in the cladistic analysis; in the second row, they identify the seven groups of the cluster analysis and, in the third row, the three groups found in PCA+CA. The colours for the cluster and PCA+CA groups are chosen to more easily visualize the agreement with the cladistic partitioning.
Current usage metrics show cumulative count of Article Views (full-text article views including HTML views, PDF and ePub downloads, according to the available data) and Abstracts Views on Vision4Press platform.
Data correspond to usage on the plateform after 2015. The current usage metrics is available 48-96 hours after online publication and is updated daily on week days.
Initial download of the metrics may take a while.