Fig. 5
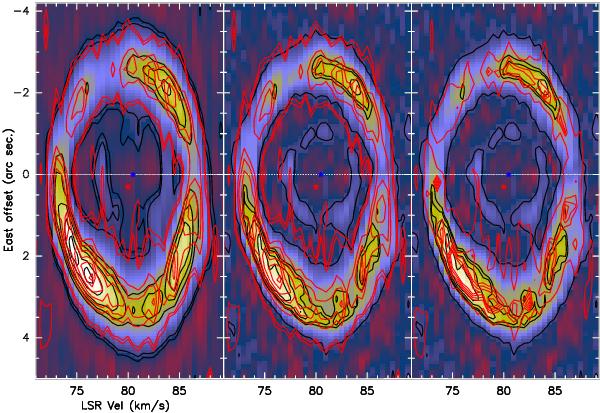
East-west position-velocity diagrams (similar to those in Fig. 3) to compare the observations performed in 1997 (in red contours) with the new data observed in 2009 (in color scale and black contours). From left to right data are synthesized with different beams. Left: all contours and the image are synthesized with the beam corresponding to the observations obtained in 1997 (of 2 38 × 104 in size, PA 7°). Center: contours are plotted with their respective original beams, of 104 and 04 in size in the east-west direction for the 1997 and 2009 observations, respectively. Right: all contours and the image are synthesized with the beam obtained in 2009. A detailed analysis is performed in Sect. 4.
Current usage metrics show cumulative count of Article Views (full-text article views including HTML views, PDF and ePub downloads, according to the available data) and Abstracts Views on Vision4Press platform.
Data correspond to usage on the plateform after 2015. The current usage metrics is available 48-96 hours after online publication and is updated daily on week days.
Initial download of the metrics may take a while.