Fig. 3
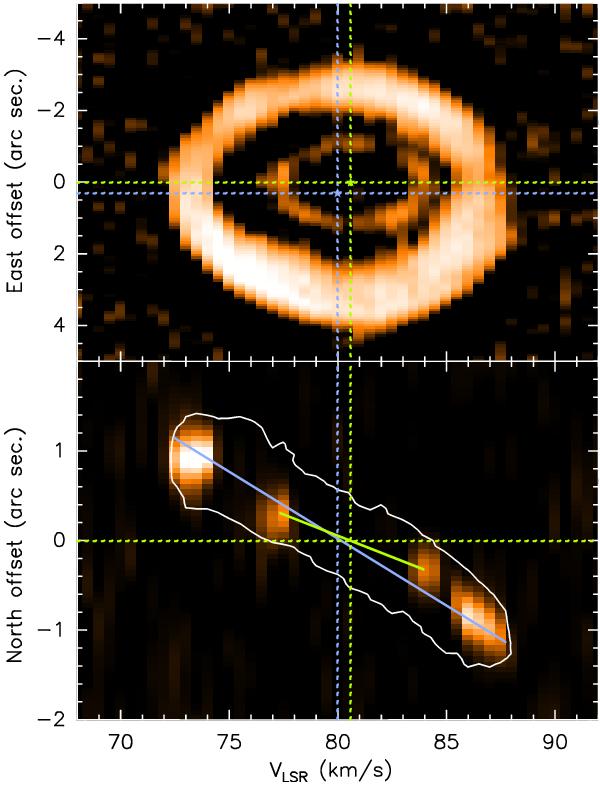
Position-velocity diagrams of the 12CO J = 2−1 line emission in M 2−9 along the east-west (on the top) and north-south (on the bottom) directions. The green (violet) dotted lines represent the kinematical and spatial center of the inner (outer) ring. Top: integrated brightness from the whole nebula. Bottom: brightness obtained within a slit along the projected symmetry axis. With a green (violet) solid line we plot the position-velocity gradient corresponding to the entire inner (outer) ring along the north-south direction. A white contour traces the emission integrated over the complete nebula at low brightness level. Note that the (VLSR) velocity axis shows the expanding gas speed projected on the line of sight. A more detailed discussion can be found in Sect. 3.2.
Current usage metrics show cumulative count of Article Views (full-text article views including HTML views, PDF and ePub downloads, according to the available data) and Abstracts Views on Vision4Press platform.
Data correspond to usage on the plateform after 2015. The current usage metrics is available 48-96 hours after online publication and is updated daily on week days.
Initial download of the metrics may take a while.