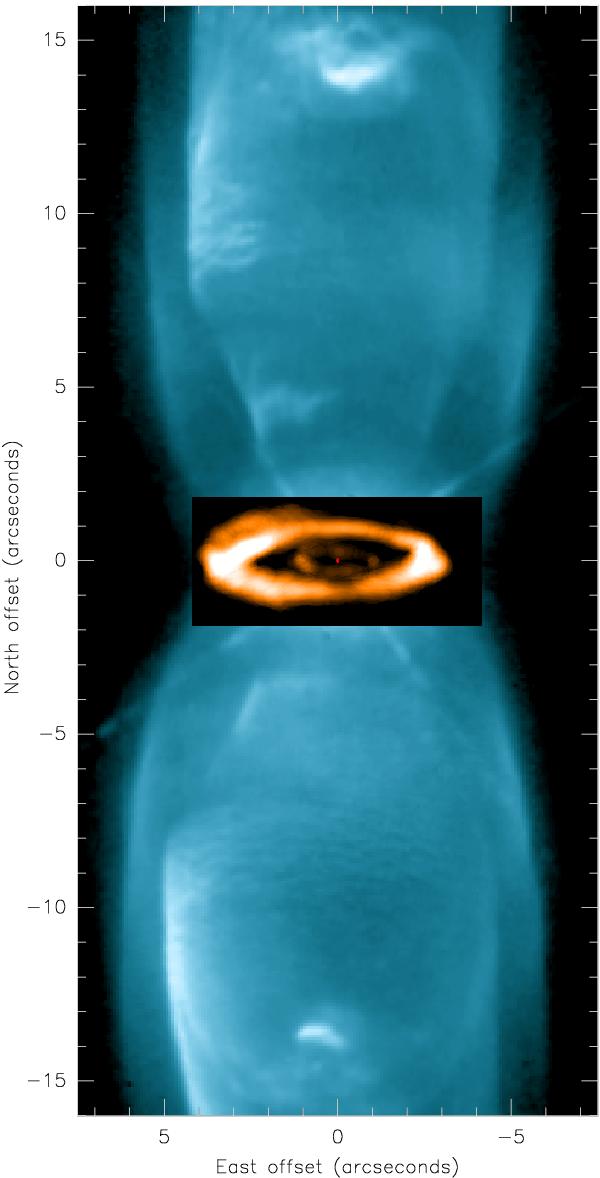
Fig. 2

Velocity-integrated 12CO J = 2−1 line emission is shown in the inset, superimposed over the optical image obtained with the Hubble Space Telescope (Balick et al. 1997). Only the brightness distribution above 60 mJy beam-1 (which corresponds to ~8σ, where σ is the root-mean-square noise) was included to better separate the close projected image of the two rings. At the center the continuum emission is represented by a red dot, which traces the position of the stellar system. More details can be found in Sect. 2.
Current usage metrics show cumulative count of Article Views (full-text article views including HTML views, PDF and ePub downloads, according to the available data) and Abstracts Views on Vision4Press platform.
Data correspond to usage on the plateform after 2015. The current usage metrics is available 48-96 hours after online publication and is updated daily on week days.
Initial download of the metrics may take a while.


