Fig. 5
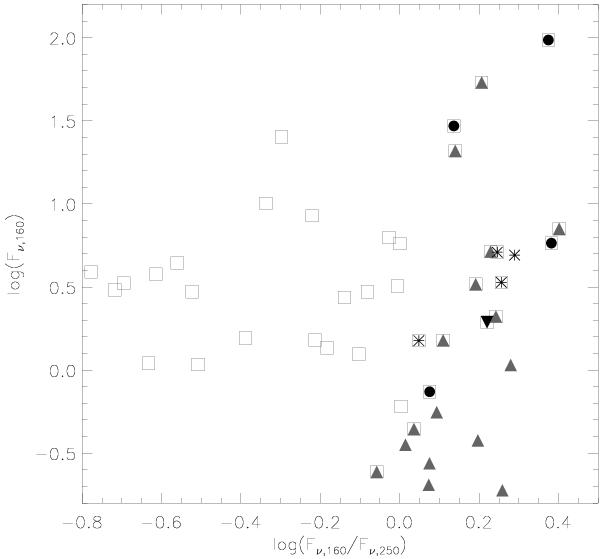
Flux-colour ratio figure log (F160) vs. log (F160/F250) showing the Herschel photometry of all sources with required photometry detected in the field. The grey triangles represent the Luhman et al. (2008) class II objects, the class I objects are shown by black circles. The flat spectrum objects are marked by asterisks. The inverted triangles mark the transition disc objects. The Herschel detections with a counterpart in the Belloche et al. (2011) catalogue are marked with open squares. These objects may be class 0 sources or starless/prestellar cores. No trend in magnitude is present, however the known YSOs exhibit a bluer colour than the candidate cores. Note that redward is to the left in this diagram.
Current usage metrics show cumulative count of Article Views (full-text article views including HTML views, PDF and ePub downloads, according to the available data) and Abstracts Views on Vision4Press platform.
Data correspond to usage on the plateform after 2015. The current usage metrics is available 48-96 hours after online publication and is updated daily on week days.
Initial download of the metrics may take a while.