Fig. 4
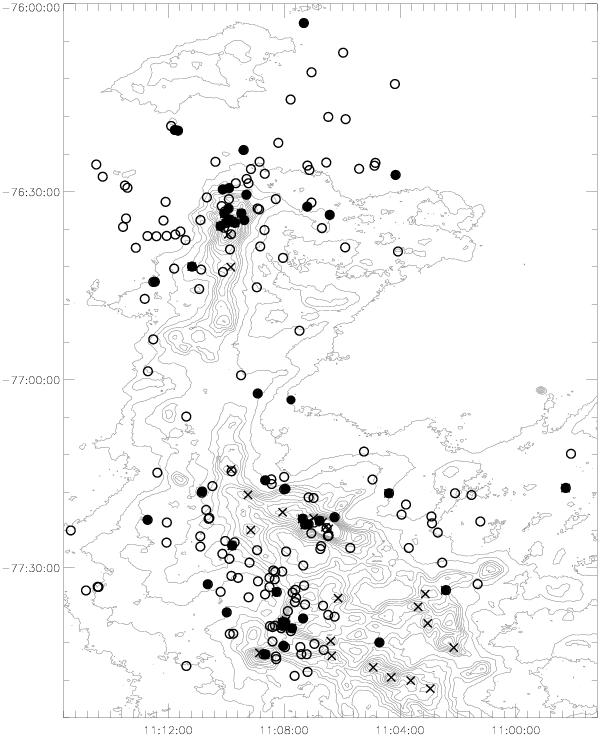
Contours of the SPIRE 500 μm mosaic, showing the elongated structure of the dust, shown at levels of 30, 40, 45, 50, 55, 60, 65% of the peak flux 13.4 Jy/beam. The open circles indicate the positions of the Spitzer identified YSOs (Luhman et al. 2008), the filled circles are those YSOs also detected with Herschel. The “x” symbols mark the positions of the Herschel sources matched to Belloche et al. (2011) detections; excluding three which are off-field to the west. It may be noted that the Herschel detected YSOs are mainly located in and near the centres of the three clusters. North is up and east is to the left, coordinates are given in Equ J2000.
Current usage metrics show cumulative count of Article Views (full-text article views including HTML views, PDF and ePub downloads, according to the available data) and Abstracts Views on Vision4Press platform.
Data correspond to usage on the plateform after 2015. The current usage metrics is available 48-96 hours after online publication and is updated daily on week days.
Initial download of the metrics may take a while.