Fig. 2
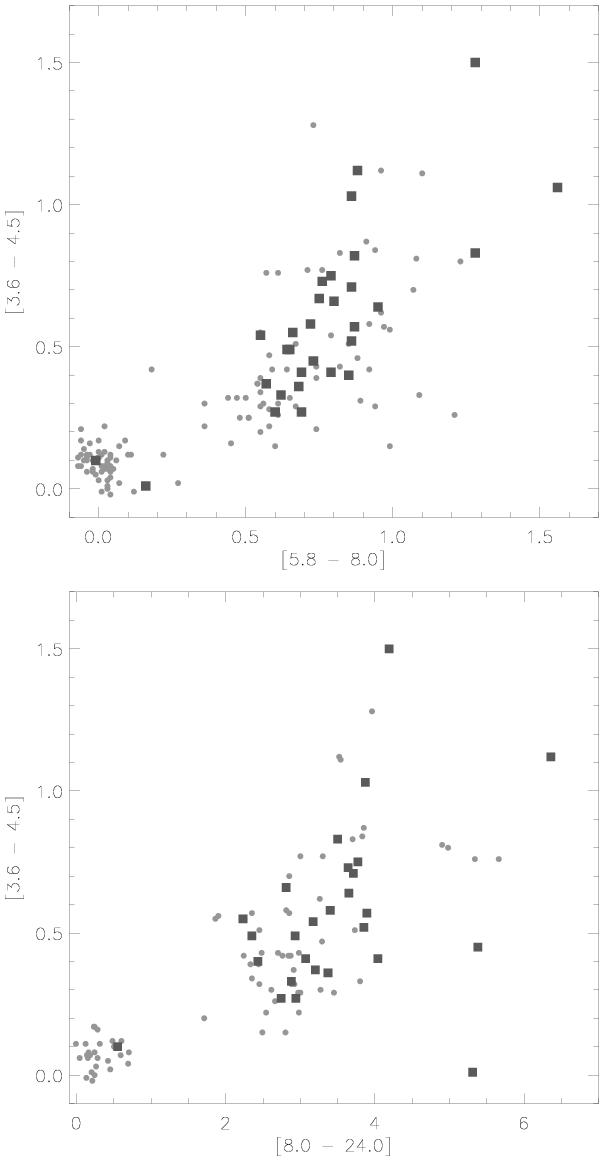
Above: Spitzer IRAC [3.6–4.5] vs. [5.8–8.0] colour–colour figure derived from the Luhman et al. (2008) photometry. Below: Spitzer IRAC-MIPS [3.6–4.5] vs. [8.0–24] colour–colour figure of the Luhman et al. (2008) YSOs. Grey dots indicate the Luhman et al. (2008) identified YSOs. The black symbols indicate those YSOs detected with Herschel. The group of YSOs clustered around [0,0] in both diagrams are the class III sources.
Current usage metrics show cumulative count of Article Views (full-text article views including HTML views, PDF and ePub downloads, according to the available data) and Abstracts Views on Vision4Press platform.
Data correspond to usage on the plateform after 2015. The current usage metrics is available 48-96 hours after online publication and is updated daily on week days.
Initial download of the metrics may take a while.