Free Access
Fig. 1
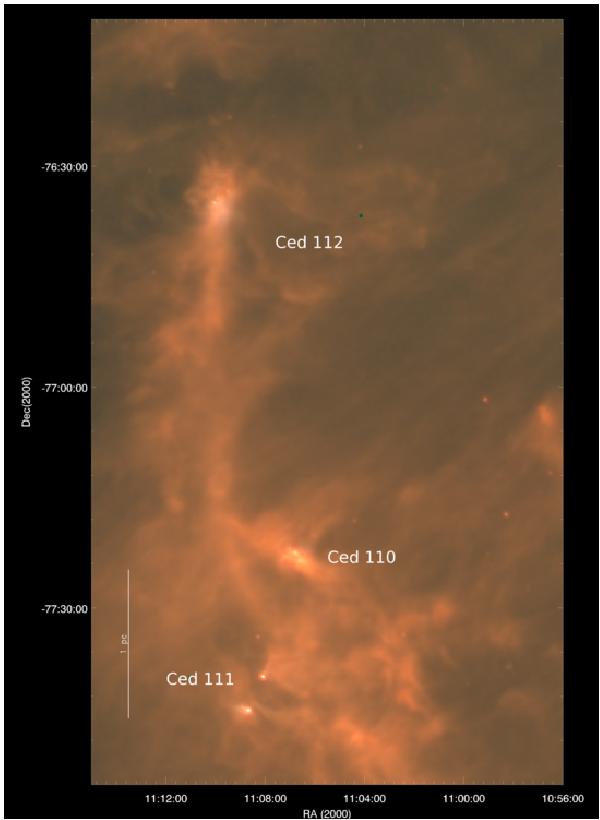
Three-band false-colour image of the Chamaeleon I region, with PACS 160 μm in blue, SPIRE 250 μm in green and SPIRE 500 μm in red. The northern region, centred on Ced 112 and HD 97300, and two southern clusters, Ced 110 and Ced111 are visible. North is up and east is to the left.
Current usage metrics show cumulative count of Article Views (full-text article views including HTML views, PDF and ePub downloads, according to the available data) and Abstracts Views on Vision4Press platform.
Data correspond to usage on the plateform after 2015. The current usage metrics is available 48-96 hours after online publication and is updated daily on week days.
Initial download of the metrics may take a while.