Free Access
Fig. 4
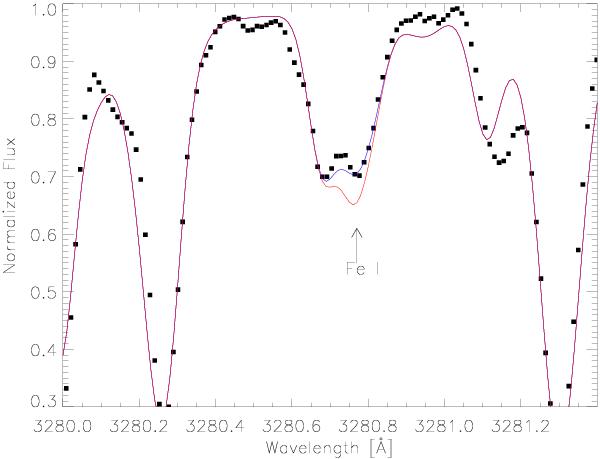
Effect of a wrong log gf of the blending Fe line (marked by an arrow) shown for HD 121004. The log gf of Fe I transition (red line) over-predicts the Fe line strength, resulting in an underestimation of the Ag abundance. The synthesis using our adjusted Fe I log gf value is shown in blue.
Current usage metrics show cumulative count of Article Views (full-text article views including HTML views, PDF and ePub downloads, according to the available data) and Abstracts Views on Vision4Press platform.
Data correspond to usage on the plateform after 2015. The current usage metrics is available 48-96 hours after online publication and is updated daily on week days.
Initial download of the metrics may take a while.