Free Access
Fig. 3
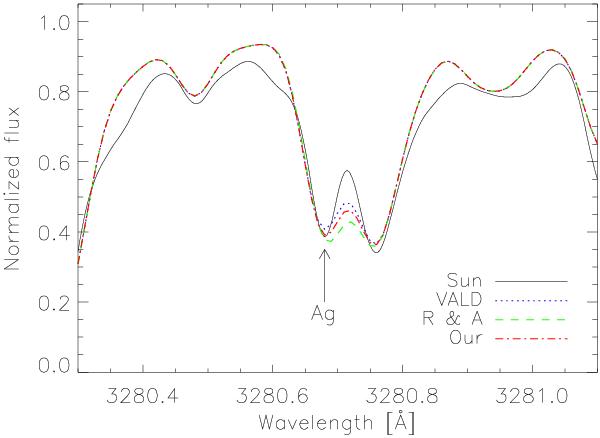
The Kitt Peak solar spectrum with spectrum synthesis computed with different line lists overplotted: VALD’s log gf without hfs (dotted blue line); our most recent log gf values (dash-dotted red line); and the old hfs (only two levels) values from Ross & Aller (1972) (R & A, dashed green line).
Current usage metrics show cumulative count of Article Views (full-text article views including HTML views, PDF and ePub downloads, according to the available data) and Abstracts Views on Vision4Press platform.
Data correspond to usage on the plateform after 2015. The current usage metrics is available 48-96 hours after online publication and is updated daily on week days.
Initial download of the metrics may take a while.