Fig. 15
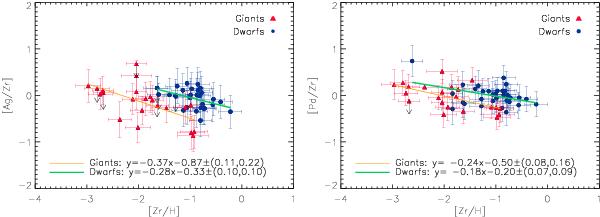
[Ag/Zr] and [Pd/Zr] vs. [Zr/H] to the left and right, respectively. The trend of the fitted line is only slightly negative, which could be interpreted as a slight correlation, but the abundances clump. Upper limits to the abundances are indicated by arrows. The formulas of the lines fitted are given in the lower left corner for giants and dwarfs, respectively.
Current usage metrics show cumulative count of Article Views (full-text article views including HTML views, PDF and ePub downloads, according to the available data) and Abstracts Views on Vision4Press platform.
Data correspond to usage on the plateform after 2015. The current usage metrics is available 48-96 hours after online publication and is updated daily on week days.
Initial download of the metrics may take a while.