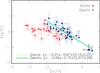
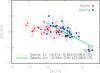
Fig. 13

[Ag/Sr] (left) and [Pd/Sr] (right) as a function of [Sr/H] is shown here for both dwarfs (filled blue circles) and giants (filled red triangles). An anti-correlation is seen in this figure, which is strongest for the dwarfs (see the slopes in the figure). The values given in parenthesis are the uncertainties in the linear fits: the first number is the error in the slope, the second number is the uncertainty in the intersection with the y-axis.
Current usage metrics show cumulative count of Article Views (full-text article views including HTML views, PDF and ePub downloads, according to the available data) and Abstracts Views on Vision4Press platform.
Data correspond to usage on the plateform after 2015. The current usage metrics is available 48-96 hours after online publication and is updated daily on week days.
Initial download of the metrics may take a while.