Free Access
Fig. 1
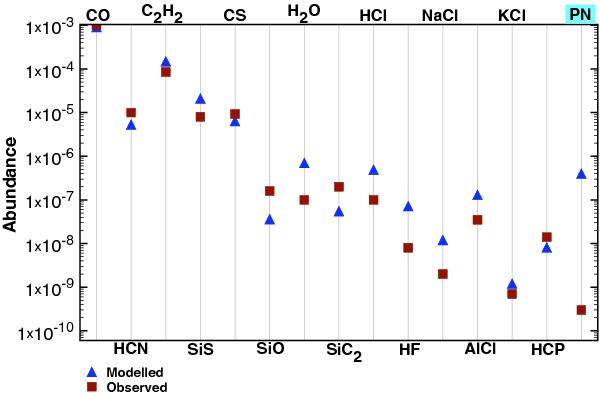
Observed and modelled abundances (with respect to H2) for most of the molecules listed in Table 4. Abundances are at phase θ = 1 and 5 R⋆. The agreement between modelled and observed values is satisfactory and less than a factor of ten for all species apart from PN (for CO both values overlap).
Current usage metrics show cumulative count of Article Views (full-text article views including HTML views, PDF and ePub downloads, according to the available data) and Abstracts Views on Vision4Press platform.
Data correspond to usage on the plateform after 2015. The current usage metrics is available 48-96 hours after online publication and is updated daily on week days.
Initial download of the metrics may take a while.