Fig. 11
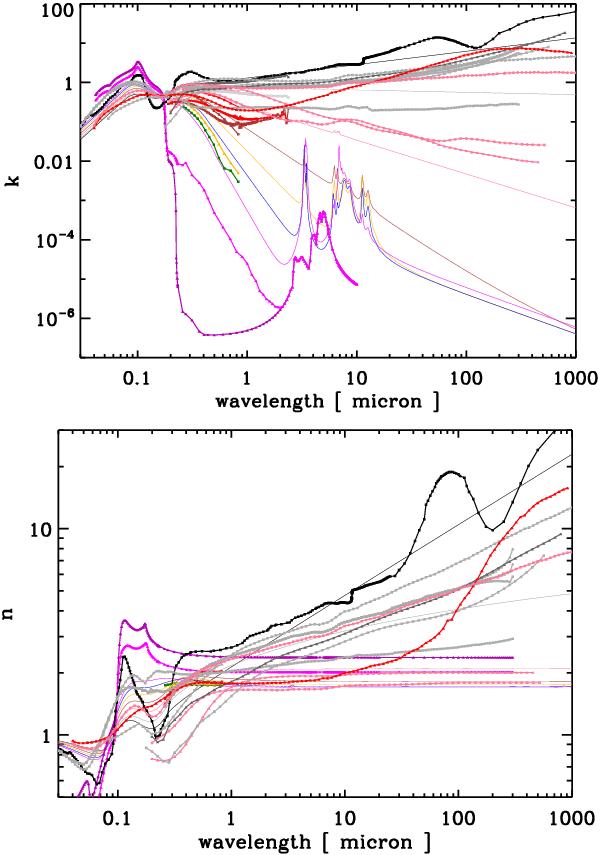
The smooth, coloured lines show the optEC(s) model-derived imaginary (top) and real (bottom) parts of the refractive index (large band gap, violet, to low band gap, grey). The lines with data points are the laboratory-measured and model-derived data (see references earlier for the sources). The upper black lines with data points show the data for graphite (Draine & Lee 1984) and the purple and violet lines with data points show the data for diamond (Edwards & Philipp 1985; Lewis et al. 1989).
Current usage metrics show cumulative count of Article Views (full-text article views including HTML views, PDF and ePub downloads, according to the available data) and Abstracts Views on Vision4Press platform.
Data correspond to usage on the plateform after 2015. The current usage metrics is available 48-96 hours after online publication and is updated daily on week days.
Initial download of the metrics may take a while.