Fig. 1
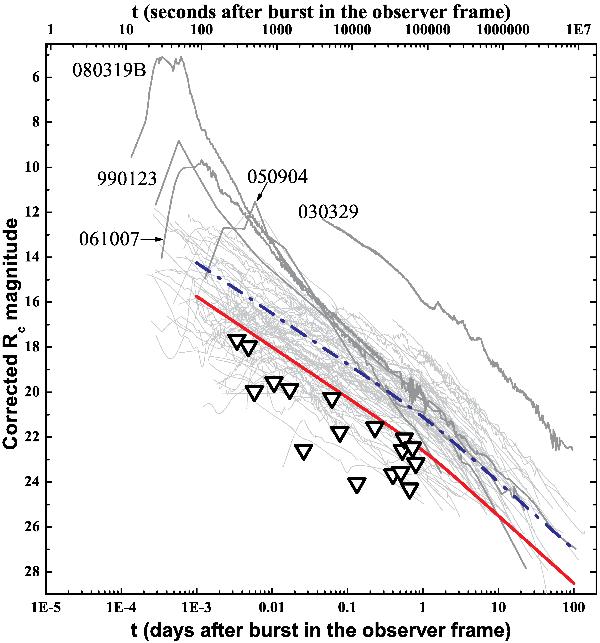
RC-band light curves of all (long) afterglows in the sample of Kann et al. (2010, 2011); some extraordinary bright events are indicated. All data have been corrected for Galactic extinction. Triangles indicate equivalent RC-band upper limits of the afterglows in our sample (Table 2). The blue dashed/dotted line approximately indicates the mean of the afterglow brightness distribution. The red straight line, 1.5 mag below the blue line, indicates the border line of all targets in our study. A colour version of the figure is available in the electronic version.
Current usage metrics show cumulative count of Article Views (full-text article views including HTML views, PDF and ePub downloads, according to the available data) and Abstracts Views on Vision4Press platform.
Data correspond to usage on the plateform after 2015. The current usage metrics is available 48-96 hours after online publication and is updated daily on week days.
Initial download of the metrics may take a while.