Fig. 9
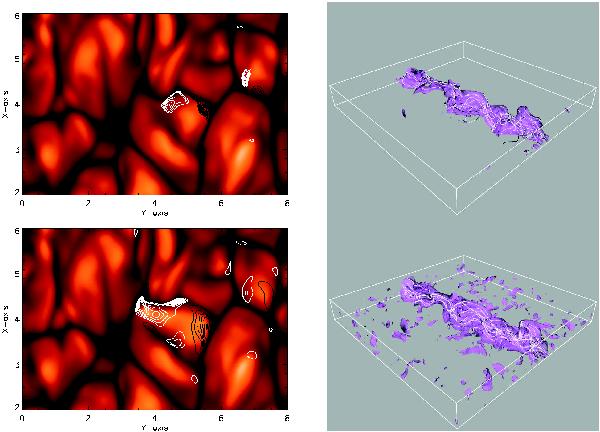
Simulations L1 (top) and WT1 (bottom) at t = 1.59. The plots on the left-hand side show the temperature distribution in a horizontal plane just below the upper surface of the computational domain (shaded contours) and the distribution of Bz in the same horizontal plane (black and white contours). The volume renderings on the right-hand side of this figure show isosurfaces of |B| = 0.25. Some fieldlines have also been traced out along these isosurfaces in order to aid visualisation.
Current usage metrics show cumulative count of Article Views (full-text article views including HTML views, PDF and ePub downloads, according to the available data) and Abstracts Views on Vision4Press platform.
Data correspond to usage on the plateform after 2015. The current usage metrics is available 48-96 hours after online publication and is updated daily on week days.
Initial download of the metrics may take a while.