Fig. 5
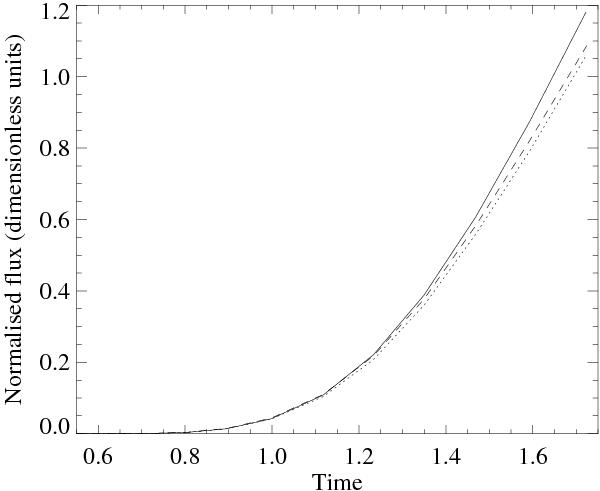
Magnitude of the total unsigned magnetic flux, Φ(t), at z = 0, plotted against time for simulations L1, L2 and L3 (the lower entropy, thin tube, ℛm ≈ 140 cases). The solid line corresponds to L1 (β = 1.5), the dotted line corresponds to L2 (β = 5), whilst the dashed line corresponds to L3 (β = 35). In each case, the flux has been normalised by the initial magnetic flux in the y-direction.
Current usage metrics show cumulative count of Article Views (full-text article views including HTML views, PDF and ePub downloads, according to the available data) and Abstracts Views on Vision4Press platform.
Data correspond to usage on the plateform after 2015. The current usage metrics is available 48-96 hours after online publication and is updated daily on week days.
Initial download of the metrics may take a while.