Fig. 9
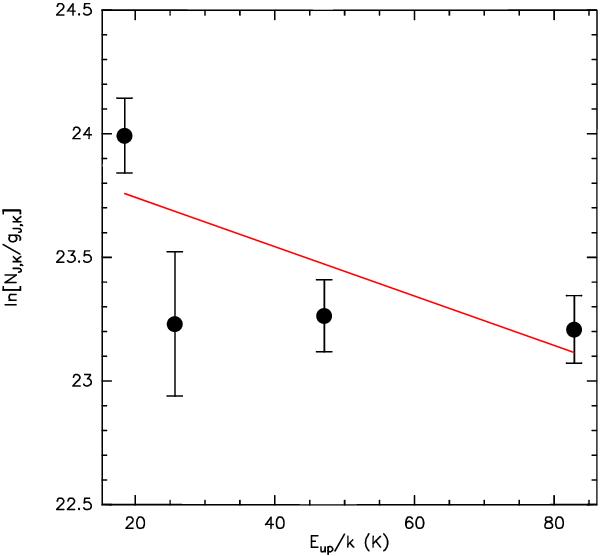
Rotational diagram of the observed K-levels of CH3CN(J = 6 → 5) towards source 13-s. The solid line is the best fit of Eq. (2), corresponding to a rotational temperature of 100 ± 60 K, in agreement with the kinetic temperature obtained with the LVG modeling of the H2CO line emission.
Current usage metrics show cumulative count of Article Views (full-text article views including HTML views, PDF and ePub downloads, according to the available data) and Abstracts Views on Vision4Press platform.
Data correspond to usage on the plateform after 2015. The current usage metrics is available 48-96 hours after online publication and is updated daily on week days.
Initial download of the metrics may take a while.