Fig. 7
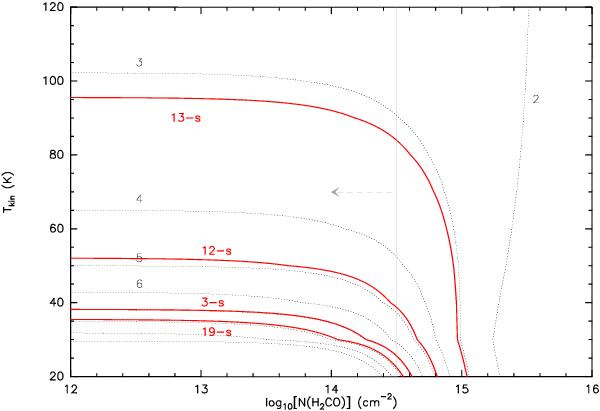
Behavior of the
R = H2CO(30,3−20,2)/H2CO(32,2−22,1)
integrated intensity ratio. The dotted contours represent the R
values from the LVG model for  (see Sect. 4.1.2) and go from 2 to 10 in unit steps. The red solid contours
are the observed R values, plotted here for cores 3-s, 12-s, 13-s,
and 19-s for viewing simplicity. The vertical gray dotted line is the
(see Sect. 4.1.2) and go from 2 to 10 in unit steps. The red solid contours
are the observed R values, plotted here for cores 3-s, 12-s, 13-s,
and 19-s for viewing simplicity. The vertical gray dotted line is the
 upper limit value obtained with the
LVG model. The effect of the optically thin/thick turnover is also seen, which
introduces the largest uncertainty in the Tk
estimation.
upper limit value obtained with the
LVG model. The effect of the optically thin/thick turnover is also seen, which
introduces the largest uncertainty in the Tk
estimation.
Current usage metrics show cumulative count of Article Views (full-text article views including HTML views, PDF and ePub downloads, according to the available data) and Abstracts Views on Vision4Press platform.
Data correspond to usage on the plateform after 2015. The current usage metrics is available 48-96 hours after online publication and is updated daily on week days.
Initial download of the metrics may take a while.