Fig. 4
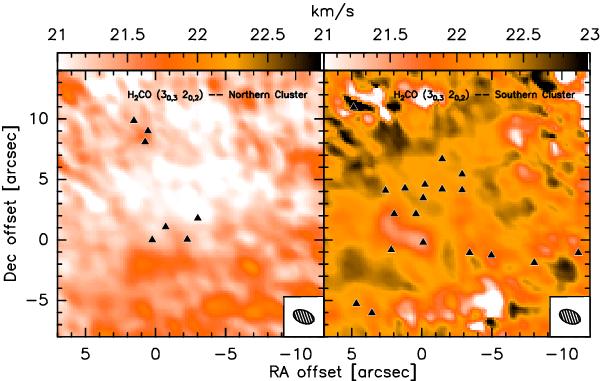
Combined PdBI and IRAM 30 m first-moment maps of H2CO(30,3−20,2) towards IRAS 19410+2336 for the northern (left panel) and southern (right panel) (proto)clusters. The triangles mark the continuum sources detected, and the beam appears in the lower-right corner of each panel. There is no signature of a strong velocity dispersion.
Current usage metrics show cumulative count of Article Views (full-text article views including HTML views, PDF and ePub downloads, according to the available data) and Abstracts Views on Vision4Press platform.
Data correspond to usage on the plateform after 2015. The current usage metrics is available 48-96 hours after online publication and is updated daily on week days.
Initial download of the metrics may take a while.