Fig. 3
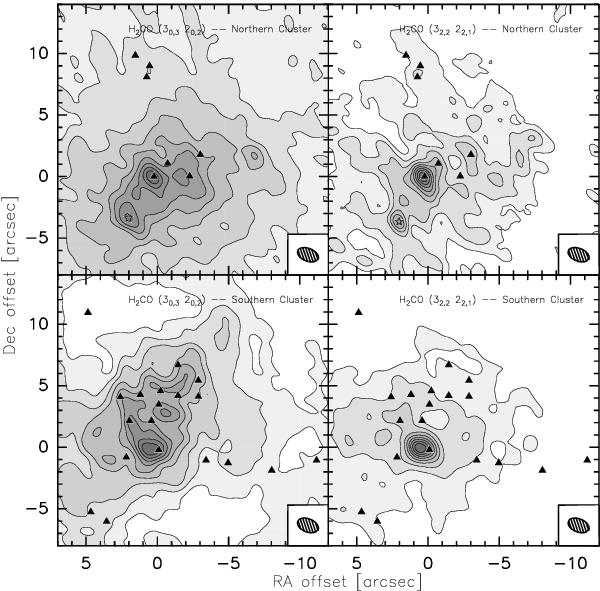
Combined PdBI and IRAM 30 m integrated emission of H2CO towards IRAS 19410+2336. In the left panels are the H2CO(30,3−20,2) transition in the northern (upper panel) and southern (lower panel) (proto)clusters, and in the right panels of the image are the H2CO(32,2−22,1) transition. The contour levels are in 10% steps of the peak integrated intensity for each map. The triangles mark the 1.4 mm sources detected, and the 1.6′′ × 1′′ beam appears in the lower-right corner of each panel.
Current usage metrics show cumulative count of Article Views (full-text article views including HTML views, PDF and ePub downloads, according to the available data) and Abstracts Views on Vision4Press platform.
Data correspond to usage on the plateform after 2015. The current usage metrics is available 48-96 hours after online publication and is updated daily on week days.
Initial download of the metrics may take a while.