Fig. 2
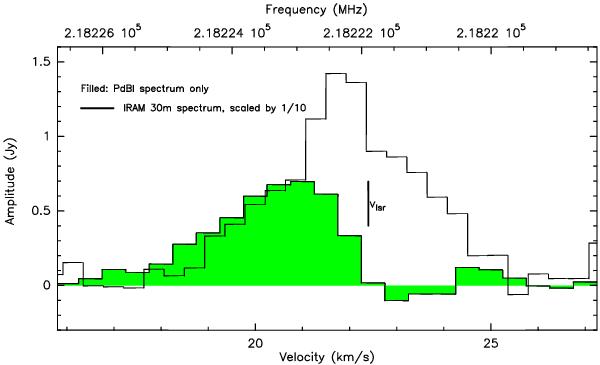
Comparison of the interferometer (PdBI, filled) and single-dish (IRAM 30 m, solid line) H2CO(30,3−20,2) line emission towards IRAS 19410+2336. Clearly seen is the “self-absorption”-like feature in the PdBI emission, denoting the missing flux coming from more extended spatial-scales and filtered out by the interferometer. The single-dish spectrum has been scaled down for comparison by a factor of ten.
Current usage metrics show cumulative count of Article Views (full-text article views including HTML views, PDF and ePub downloads, according to the available data) and Abstracts Views on Vision4Press platform.
Data correspond to usage on the plateform after 2015. The current usage metrics is available 48-96 hours after online publication and is updated daily on week days.
Initial download of the metrics may take a while.