Fig. 12
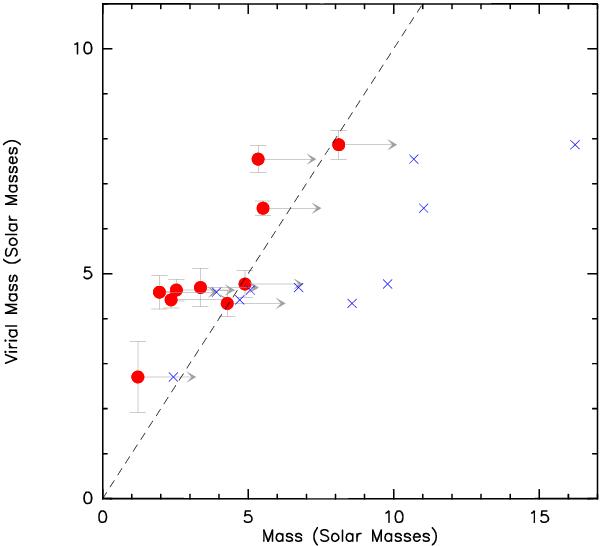
Comparison between the virial masses and gas masses of the resolved cores in IRAS 19410+2336. Virial masses are unaffected by the interferometric flux filtering, which do affect the gas masses. The red dots are the actual values obtained, while the blue crosses represent the relationship if we take into account ~10% of the flux filtered out by the interferometer. This is a hint of the care that must be taken when interpreting interferometric flux values.
Current usage metrics show cumulative count of Article Views (full-text article views including HTML views, PDF and ePub downloads, according to the available data) and Abstracts Views on Vision4Press platform.
Data correspond to usage on the plateform after 2015. The current usage metrics is available 48-96 hours after online publication and is updated daily on week days.
Initial download of the metrics may take a while.