Free Access
Fig. 4
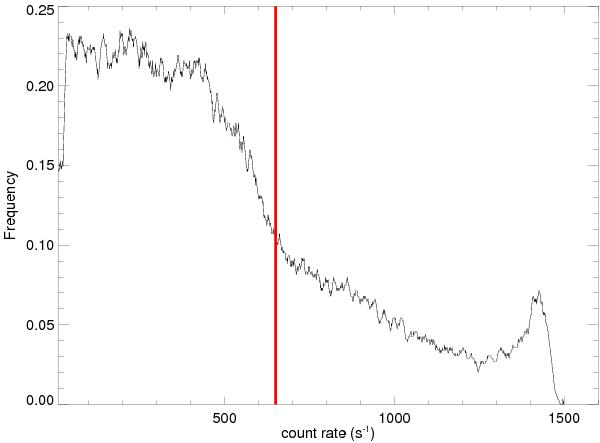
Distribution of the X-ray count-rate observed by SphinX between 2009 May 7 and 2009 May 24. The red vertical line indicates the threshold chosen to extract the low count-rate spectrum and the high count-rate spectrum (see text).
Current usage metrics show cumulative count of Article Views (full-text article views including HTML views, PDF and ePub downloads, according to the available data) and Abstracts Views on Vision4Press platform.
Data correspond to usage on the plateform after 2015. The current usage metrics is available 48-96 hours after online publication and is updated daily on week days.
Initial download of the metrics may take a while.