Free Access
Fig. 3
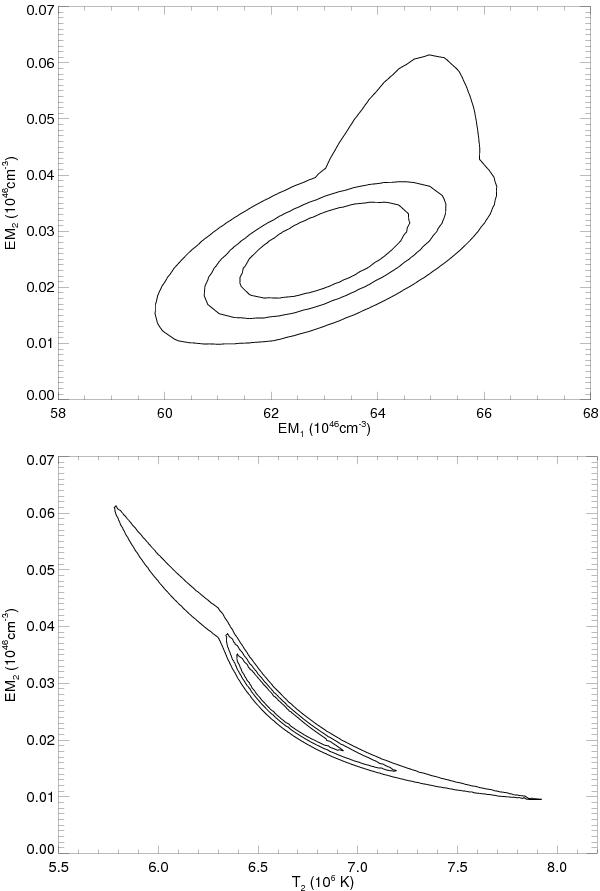
Upper panel: the 68%, 90%, and 99% confidence contour levels of the emssion measure of the hot component, EM2, versus the emission measure of the warm component EM1 obtained with the 2T model. Lower panel: same as upper panel for EM2 and T2.
This figure is made of several images, please see below:
Current usage metrics show cumulative count of Article Views (full-text article views including HTML views, PDF and ePub downloads, according to the available data) and Abstracts Views on Vision4Press platform.
Data correspond to usage on the plateform after 2015. The current usage metrics is available 48-96 hours after online publication and is updated daily on week days.
Initial download of the metrics may take a while.