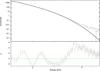
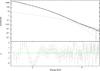
Fig. 2
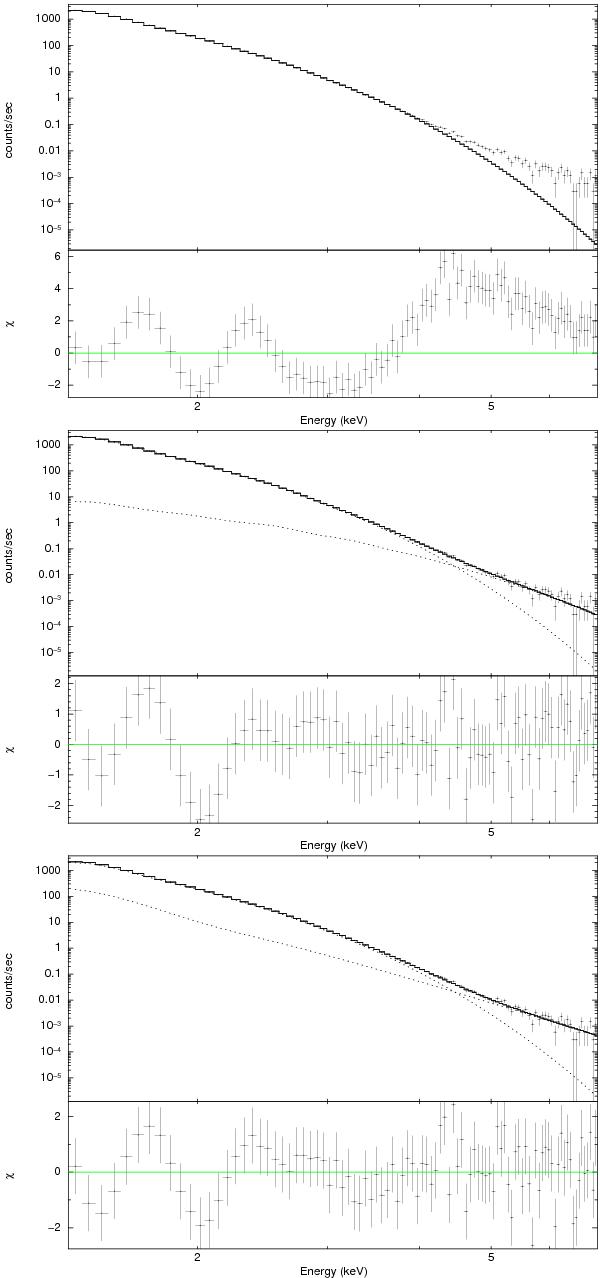
Upper panel: SphinX spectrum of the solar corona collected between 2009 May 7 and 2009 May 24, together with its best-fit model consisting of one isothermal component and residuals. Middle panel: same as upper panel with a two-component thermal model. The contribution of each component is shown. Lower panel: same as middle panel with the 1T-Pow model.
Current usage metrics show cumulative count of Article Views (full-text article views including HTML views, PDF and ePub downloads, according to the available data) and Abstracts Views on Vision4Press platform.
Data correspond to usage on the plateform after 2015. The current usage metrics is available 48-96 hours after online publication and is updated daily on week days.
Initial download of the metrics may take a while.