Fig. 5
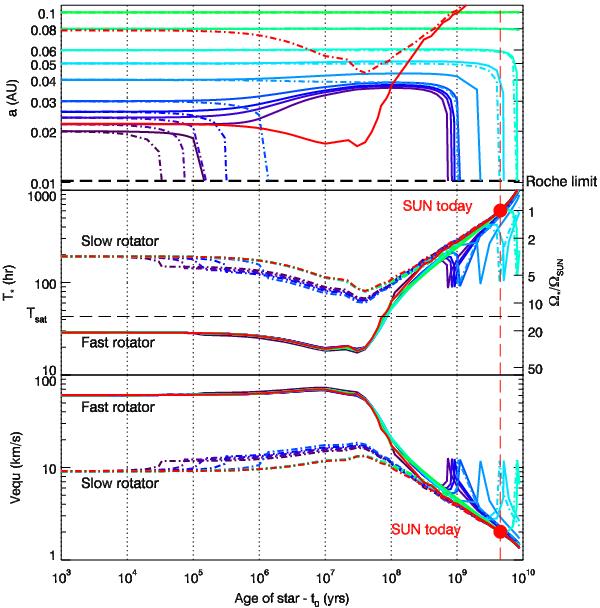
Tidal evolution of Jupiter-mass planets of different initial orbital distance around either a rapidly rotating or a slowly rotating 1 M⊙ star with a large dissipation factor. Top panel: the colored lines represent the semi-major axis of the planets. Solid lines correspond to an initially fast-rotating star and dashed dotted lines to an initially slow-rotating star. The red curves represent the corotation radius assuming no planet. Middle panel: evolution of the stellar rotation period. Bottom panel: evolution of the equatorial velocity of the star. In the middle and bottom panels, a red full circle represents the Sun’s present rotation, and the red curves correspond to stars with no planets.
Current usage metrics show cumulative count of Article Views (full-text article views including HTML views, PDF and ePub downloads, according to the available data) and Abstracts Views on Vision4Press platform.
Data correspond to usage on the plateform after 2015. The current usage metrics is available 48-96 hours after online publication and is updated daily on week days.
Initial download of the metrics may take a while.