Fig. 4
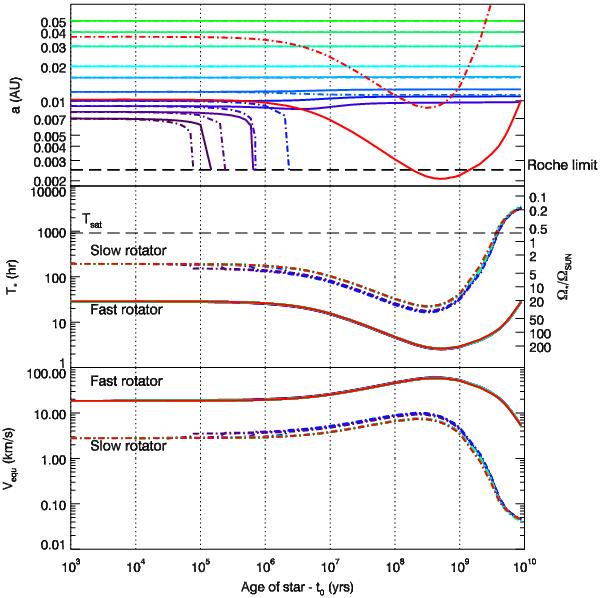
Tidal evolution of 10 M⊕ mass planets starting with different initial semi-major axes around either a rapidly rotating or a slowly rotating 0.1 M⊙ star with a mean dissipation factor. Top panel: evolution of the semi-major axis. The full colored lines correspond to rapidly rotating stars and the dash-dotted lines correspond to slowly rotating stars. The solid and dash-dotted red lines represent the evolution of the corotation radius in both cases when there is no planet. The long black dashes represent the Roche limit. Middle panel: the corresponding stellar rotation evolution (the same line code is used). The black long dashes represent Tsat = 2π/ωsat. Bottom panel: equatorial velocity of the star vs. time (the same line code is used).
Current usage metrics show cumulative count of Article Views (full-text article views including HTML views, PDF and ePub downloads, according to the available data) and Abstracts Views on Vision4Press platform.
Data correspond to usage on the plateform after 2015. The current usage metrics is available 48-96 hours after online publication and is updated daily on week days.
Initial download of the metrics may take a while.