Fig. 1
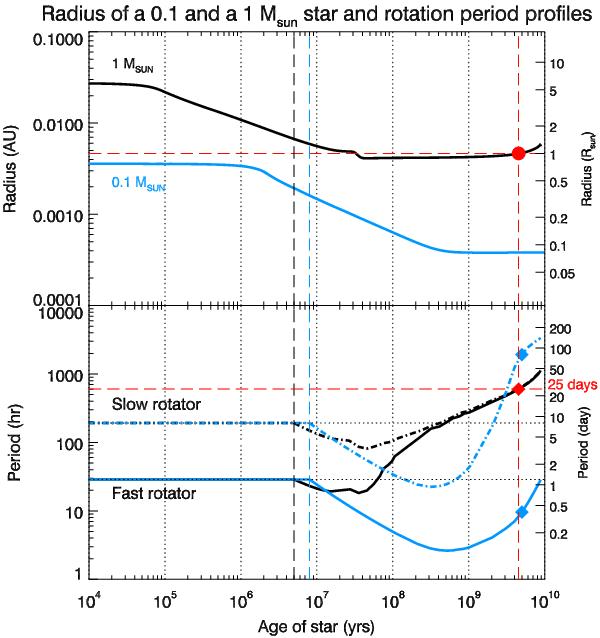
Radius (top panel) and spin (bottom panel) evolution of a 0.1 M⊙ and a 1 M⊙ star. In the bottom panel, the full and dashed dotted blue lines represent, respectively, the evolution of the rotation period of an initially fast rotating star and an initially slow rotating star with no planet. As in the top panel, the blue curves correspond to the 0.1 M⊙ star and the black curves to the solar-mass star. The blue diamonds in the bottom panel correspond to the values of the spin at 5 Gyr for the two extreme trends of Irwin et al. (2011). The vertical dashed lines represent t0 for the two stellar masses.
Current usage metrics show cumulative count of Article Views (full-text article views including HTML views, PDF and ePub downloads, according to the available data) and Abstracts Views on Vision4Press platform.
Data correspond to usage on the plateform after 2015. The current usage metrics is available 48-96 hours after online publication and is updated daily on week days.
Initial download of the metrics may take a while.