| Issue |
A&A
Volume 544, August 2012
|
|
|---|---|---|
| Article Number | L2 | |
| Number of page(s) | 4 | |
| Section | Letters | |
| DOI | https://doi.org/10.1051/0004-6361/201219638 | |
| Published online | 24 July 2012 | |
Activity restart – a key to explaining the morphology of J1211+743
Toruń Centre for Astronomy, N. Copernicus University,
87-100
Toruń,
Poland
e-mail: This email address is being protected from spambots. You need JavaScript enabled to view it.
Received: 21 May 2012
Accepted: 15 June 2012
Abstract
J1211+743 is a giant radio galaxy with a one-sided jet and two asymmetric lobes, one of which is of Fanaroff-Riley (FR) type II with a hotspot and the other is a diffuse relic devoid of a hotspot. The jet points towards the latter lobe, which is difficult to explain in a standard way within the double-lobed radio source paradigm. Here, I propose to assume that the nucleus of J1211+743 has undergone a re-ignition of activity and its lobes, presumably both originally of FR II type, represent an earlier active phase, while the jet represents the current one. The asymmetry of the lobes is a consequence of the orientation of the source combined with an activity switch-off that occurred between two active periods. The relic lobe is on the near side with regard to the observer, whereas the radiation from the far-side lobe arrives significantly later owing to its longer distance to the observer. The far-side lobe is thus perceived to have not yet decayed. On the other hand, the jet behaves in a standard way, i.e. its projected orientation reflects the near side of the source. Hence, we are able to explain why the location of the relic lobe correlates with the direction of the jet.
Key words: radio continuum: galaxies / galaxies: active / galaxies: individual: J1211+743
© ESO, 2012
1. Introduction
J1211+743 (4CT 74.17.01) is a z = 0.107 radio galaxy belonging to the Abell 1500 cluster. An early multi-frequency radio survey of J1211+743 was conducted by van Breugel & Willis (1981) with the Westerbork Synthesis Radio Telescope (WSRT) at 609, 1415, and 4996 MHz. Zhao et al. (1989) and Lara et al. (2001) presented good-quality images resulting from the Very Large Array (VLA) observations at 1.4 GHz. The most recent maps of J1211+743 were published by Pirya et al. (2011, hereafter PNSS) following the observations at 239, 333, and 607 MHz carried out using the Giant Metrewave Radio Telescope (GMRT) and at 4885 MHz using the VLA. The 607-MHz GMRT image shows the source with the greatest detail available to date. On the basis of the above radio imagery, it can be firmly asserted that the radio structure of J1211+743 consists of a one-sided jet originating in the infrared object 2MASX J12115859+7419038 and two lobes that straddle this object. The projected linear size of the whole radio structure is 846 kpc (PNSS).
J1211+743 has two interesting properties: its lobe asymmetry and “non-standard” orientation of the jet. While the southern lobe is clearly of Fanaroff-Riley (FR) type II (Fanaroff & Riley 1974), the northern one is devoid of a hotspot and has a steeper spectrum (α = −1.02) relative to its southern counterpart (α = −0.88). (Both of these spectral indices are taken from PNSS.) It therefore appears as if the northern lobe is not at present being fuelled. However, this notion is at odds with the orientation of the jet, which points to that lobe. The simplest, but not necessarily correct, way to overcome this difficulty is to assume that the jet and the lobe on its side are aggregated and that they both form an FR I-type structure. Under this assumption, J1211+743 should consequently be labelled a HYbrid MOrphology Radio Source (HYMORS), i.e. a source each of whose sides are of a different FR type (Gopal-Krishna & Wiita 2000; Gawroński et al. 2006).
The hypothesis that J1211+743 is a HYMORS is, however, not entirely justified. Firstly, the configuration of magnetic fields along the jet is typical of those in FR II-type sources (van Breugel & Willis 1981). Therefore, one has to make a speculative assumption that the jet in J1211+743 is highly dissipative for the lobe facing it to be diffuse. Another problem – already noted by PNSS based on their measurements – is that the values of the low-frequency spectral indices at the outer edges of the lobes are consistent with those provided by low-frequency observations of luminous FR II radio sources. These circumstances are clearly incompatible with the assumption that the northern lobe of J1211+743 is of FR I type. This conclusion is additionally supported by the low-resolution WSRT maps of van Breugel & Willis (1981), particularly their 609-MHz map, where the source appears as a triple that does not resemble an FR I radio galaxy. It follows that there are insufficient grounds for aggregation of the jet and the lobe on its side. These two components seem to be separate entities and their connection, likely caused by the projection, is only apparent. On the basis of the appearance of the source in the 607-MHz GMRT map by PNSS, it could be even argued that there is no physical connection at all, i.e. the tip of the jet is located outside the boundaries of the northern lobe. If this is the case, the jet is not energising the lobe and the alignment of these two components is merely coincidental.
As J1211+743 does not appear to be a HYMORS, in Sect. 2 I present an alternative interpretation of its radio morphology that consistently explains the nature of this source.
2. A model based on an activity restart
2.1. The concept
Assume that the activity of the central engine of J1211+743 ceased at some point in the past. When this happened, i.e. when the nucleus ended its supply of relativistic plasma via jets to the hotspots, the lobes started to become weak and diffuse, while their spectra steepened owing to radiation and expansion losses. The lobes are, however, huge reservoirs of energy, so even when not being fed by the jets, they are observable for a substantial amount of time, up to 108 yr according to Komissarov & Gubanov (1994). The hotspots fade in radio brightness much sooner than the lobes – their lifetimes are roughly 7 × 10⁴ yr (Kaiser et al. 2000), hence they are normally not seen in coasting lobes. Therefore, a faint, diffuse, and steep-spectrum relic lobe devoid of a hotspot is a good signature of the energy cut-off (Kaiser & Cotter 2002).
If a coasting, large-scale, double-lobed radio source does not lie close to the sky plane, then the light-travel time difference between the images of the lobes is significant: they are observed at two completely different stages of their decay. For typical linear sizes of a large-scale FR II source (hundreds of kpc) and assuming even quite moderate angles between the source axis and the sky plane, the time lag may easily become longer than the aforementioned lifetime of a hotspot. Thus, the far-side lobe may still be perceived as a typical FR II-like with a hotspot, whereas the near-side one, representing a much later stage of the evolution of the radio source, may be seen as a diffuse relic without a hotspot. This argument was already used by Marecki & Swoboda (2011) to explain the lobe asymmetry in radio sources they studied.
On the basis of the analysis of their data, PNSS conclude that the axis of J1211+743 makes an angle close to 45° with the line of sight. It follows that the difference between the radial distances to the extreme regions (“tips”) of the lobes is roughly equal to the projected linear size of the source. Because of this size (846 kpc), we perceive radiation from the tip of the far-side lobe as being delayed by 2.76 × 10⁶ yr relative to that from the tip of the near-side lobe. The length of this period exceeds hotspot longevity by 1.6 dex, so it is quite likely that the observer finds that the near-side hotspot disappears while the far-side hotspot remains in place, which is exactly what is observed in J1211+743. On the other hand, the 2.76 × 10⁶-year lag between the images of the lobes falls short by ~1.5 dex of the time required for the near-side lobe to disperse fully (Komissarov & Gubanov 1994), so given that the far-side lobe resembles a standard FR II, the near-side one must be visible too, which is what we see. Hence, the lobe asymmetry is convincingly explained by activity cessation.
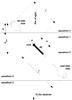 |
Fig. 1 A schematic diagram of J1211+743. (Lengths and distances are not drawn to scale.) |
The activity can be restarted, however, leading to the emergence of a newly formed jet. Since the orientation of the source with regard to the line of sight is close to 45° (PNSS), i.e. close to the galaxy/quasar dividing line (Barthel 1989), the jet is one-sided and indicates which side of the radio source is closest to the observer. Consequently, the following spatial coincidence occurs: the jet and the decaying lobe lie on the same side. This coincidence is an analogue of the Laing-Garrington effect (Laing 1988; Garrington et al. 1988), but here, instead of the correlation being between the jet orientation and polarisation asymmetry, there is a correlation between the jet orientation and morphological asymmetry.
I now present a detailed timeline of the evolution of J1211+743, which is illustrated with a schematic view of the source (Fig. 1). This diagram is by no means a paraphrasing of the radio map of J1211+743. While the map is a projection of the source onto the sky plane, the plane of the drawing in Fig. 1 is defined so as to include the observer, the core of J1211+743, the line of sight, both lobes, and the axis connecting them1. In other words, the normal to the plane of the drawing in Fig. 1 is tangential to the celestial sphere at the position of J1211+743 and perpendicular to the source’s projected axis. The north-western (near-side) lobe is at the lower right of Fig. 1, while the south-eastern (far-side) lobe is at the upper left.
2.2. The timeline
-
1.
The nucleus of J1211+743 was originally active, producingjets for a sufficiently long period of time to inflate the large lobeswe observe now. Their separation is also very large: assuming anangle of 45° between the source axis and the line of sight (PNSS) and given the projected linear size of 846 kpc, the actual linear size of the whole radio structure is 1.2 Mpc. Hence, J1211+743 could be labelled a giant radio galaxy.
-
2.
The activity of the nucleus ceased at some point in the past, which led to the cut-off of the stream of relativistic plasma. The information about this event is carried by the last jet particles to be emitted moving at the velocity βjetc where
 , i.e. it travelling through the jets’ channels towards the lobes with a velocity close to the speed of light. Empty jet channels collapse quickly – the timescale of this process is of the order of 104 yr (Brocksopp et al. 2011).
 -
3.
After time period t1 = l1/βjetc, the information that there is no more energy supply reaches the hotspot of the far-side lobe. Similarly, after t2 = l2/βjetc, analogous information arrives at the hotspot of the near-side lobe. The radio emission carrying the information about the status (images) of the far-side and near-side lobes at the instants when each of them has just begun to no longer be fuelled is represented by wavefronts “1” and “3”, respectively (see Fig. 1). As can be clearly seen in Fig. 1, l1 < l2, which is consistent with the images of J1211+743, particularly those in PNSS. For simplicity, I assume that the arm-length asymmetry is entirely intrinsic, and thus that wavefront “1” departs its lobe prior to wavefront “3”.
-
4.
After tdecay = 7 × 10⁴ years relative to the events represented by wavefronts “1” and “3”, the hotspots faded in radio brightness. The radio emission carrying the information about each of these two events is represented by wavefronts “2” and “4”, respectively.
-
5.
Meanwhile, the activity of the nucleus (denoted as “core” in Fig. 1) had restarted. I assume that the period of quiescence of the nucleus tq was longer that the lifetime of the jet channels (104 yr), so they had collapsed before the activity re-ignition and the new jets had to “drill” them anew. Nevertheless, the advance velocity of the jet, βadvc in such circumstances is considerably larger than 0.03 c, which is typical of lobes advancing through an intact intergalactic medium. For example, in a well-known double-double radio galaxy B 1834+620, this velocity is in the range 0.19 < βadv < 0.29 (Schoenmakers et al. 2000).
-
6.
At a certain instant, the length of the jet attains d and radiation carrying the information about the location of its tip is emitted. This event is represented by wavefront “5”, which is the one currently passing the observer.
Our model is compatible with the observations only if wavefront “5” lies between wavefronts “1” and “4”, as shown in Fig. 1. In other words, as wavefront “5” passes the observer, wavefront “4” must have already passed, i.e. the near-side hotspot appears to be already dispersed, whereas wavefront “1” has not yet passed by, i.e. the far-side hotspot remains visible. To show that such a situation is possible, a quantitative analysis of our model must be carried out.
2.3. Quantitative analysis
Before proceeding with the quantitative analysis, I note one assumption that is made throughout. As can be seen in Fig. 1, the axis of the source and the jet make the same angle θ with the line of sight. Whether this is indeed the case for J1211+743 cannot be easily verified so this is only an assumption. In making it, I rely on the presumed analogy between J1211+743 and double-double sources, where activity restart surely takes place (see the review of Saikia & Jamrozy 2009) and where a good alignment between the axis of an outer (old) and an inner (new) pair of lobes is observed. However, it cannot be ruled out that the jet in J1211+743 is ejected in a different direction and that the “old” and the “new” axes coincide only apparently owing to their particular orientations and projections on the sky plane that conceal this difference. Moreover, each arm of the radio source may in principle have a different value of θ, but since I carried out a separate analysis for each lobe, this did not introduce uncertainty into my results.
As a first step of the quantitative analysis, I verify whether wavefront “4” always precedes wavefront “5”. This condition is fulfilled if the time of propagation of the information about the energy cutoff in the channel of the near-side jet t2 when increased by the time of hotspot dispersion tdecay does not exceed the sum of the durations of the quiescence period tq, the time needed by the jet to attain its present length d, and the time wavefront “5” spends travelling before it reaches the point along the line of sight that wavefront “4” started from, given by 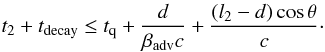 (1)Solving Eq. (1) for tq, one gets
 ![Mathematical equation: \begin{equation} t_{\rm q} \geq {1\over c} \left[{l_2\over\beta_{\rm jet}} + c t_{\rm decay} - {d\over\beta_{\rm adv}} - (l_2 - d)\cos\theta \right]. \end{equation}](/articles/aa/full_html/2012/08/aa19638-12/aa19638-12-eq25.png) (2)From the observations, we have l2sinθ = 484 kpc (PNSS) and dsinθ = 160 kpc (van Breugel & Willis 1981). Using these values for l2 and d, and substituting any value of βadv from the range obtained by Schoenmakers et al. (2000) and βjet even as low as 0.9, I found that if only θ < 88.7° then Eq. (2) was fulfilled even for the lowest possible tq = 104 yr. However, given the lack of a counter-jet in J1211+743, it is highly unlikely that it lies close to the sky plane, and so it is almost certain that θ is far below 88.7°. It follows that Eq. (2) is always fulfilled.
(2)From the observations, we have l2sinθ = 484 kpc (PNSS) and dsinθ = 160 kpc (van Breugel & Willis 1981). Using these values for l2 and d, and substituting any value of βadv from the range obtained by Schoenmakers et al. (2000) and βjet even as low as 0.9, I found that if only θ < 88.7° then Eq. (2) was fulfilled even for the lowest possible tq = 104 yr. However, given the lack of a counter-jet in J1211+743, it is highly unlikely that it lies close to the sky plane, and so it is almost certain that θ is far below 88.7°. It follows that Eq. (2) is always fulfilled.
Now I investigate the necessary conditions for wavefront “1” remain behind wavefront “5”: b ≤ bmax, where bmax = (l1 + d)cosθ. On a purely qualitative basis, this implies that there is an upper limit to tq, because if the activity is restarted after an excessively long break, and so the jet starts its build-up too late, it will be unable to attain the observed length d before the arrival of the information that the far-side hotspot has started to fade out. Therefore, I will calculate the upper limit to tq and check whether it is longer than the lower limit tq = 104 yr. If it appears to be the case, i.e. if a range of allowable values of tq does exist, we will have proof that our scenario is plausible.
The condition b ≤ bmax is fulfilled if the sum of the duration of quiescence period tq and the time needed by the jet to attain its present length d does not exceed the sum of the time of propagation of the information about the energy cutoff in the channel of the far-side jet t1 and the light-travel time over the distance bmax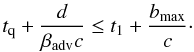 (3)Solving Eq. (3) for tq, one gets
 ![Mathematical equation: \begin{equation} t_{\rm q} \leq {1\over c} \left[{l_1\over\beta_{\rm jet}} - {d\over\beta_{\rm adv}} + (l_1 + d)\cos\theta \right]. \end{equation}](/articles/aa/full_html/2012/08/aa19638-12/aa19638-12-eq39.png) (4)When one substitutes l1 = 512 kpc and d = 226 kpc2 from the observations by PNSS and van Breugel & Willis (1981), respectively, into Eq. (4), one finds that this relation is fulfilled for βadv ≥ 0.219. This is close to the smallest value of βadv given by Schoenmakers et al. (2000) for B 1834+620. On the other hand, βadv = 0.29, i.e. the largest value of βadv according to Schoenmakers et al. (2000), yields the upper limit tq = 8.3 × 10⁵ yr. This proves that our scenario is plausible.
(4)When one substitutes l1 = 512 kpc and d = 226 kpc2 from the observations by PNSS and van Breugel & Willis (1981), respectively, into Eq. (4), one finds that this relation is fulfilled for βadv ≥ 0.219. This is close to the smallest value of βadv given by Schoenmakers et al. (2000) for B 1834+620. On the other hand, βadv = 0.29, i.e. the largest value of βadv according to Schoenmakers et al. (2000), yields the upper limit tq = 8.3 × 10⁵ yr. This proves that our scenario is plausible.
The above result has been achieved under the assumption made by PNSS that θ = 45°. Additionally, βjet = 1 has been assumed for simplicity. I now test whether our model remains plausible if three parameters in Eq. (4) – βjet, βadv, and θ – are varied. To this end, I substitute values from the range 10° ≤ θ ≤ 80° and 0.2 ≤ βadv ≤ 0.35 into Eq. (4), and calculate the upper limits to tq (in Myr) for βjet = 1 and βjet = 0.9. The results for different combinations of θ, βadv, and βjet are given in Table 1. The lack of a number at the crossing of a given row and column means that the respective combination of parameters is not allowed if the scenario is to be viable.
3. Conclusion
Recurrent activity in active galactic nuclei is a well-known phenomenon (Saikia & Jamrozy 2009). In this letter, I have demonstrated that the radio morphology of J1211+743 can be understood in the framework of a restarted activity scenario combined with the assumption that the radio source does not lie in the sky plane. Owing to the latter circumstance, each lobe is observed at a different epoch and this renders them a different appearance. On the other hand, the activity re-ignition is manifested by the presence of the jet whose direction, apparently paradoxically, correlates with the location of the relic lobe.
Our model requires that there is an upper limit to duration of the quiescent period between the two active periods. This limit strongly depends on the jet advance velocity βadv and inclination angle θ. As can be seen in Table 1, for a wide range of values of θ and for several values of βadv typical of restarted sources known from the literature, the upper limits are of the order of about 106 years. This means that our model is realistic, because quiescent periods of this length are allowed. Depending on the mechanism, activity intermittency can operate on very different timescales that are either long in the case of ionisation instability in the accretion disk (Hatziminaoglou et al. 2001; Janiuk et al. 2004, and references therein) or short in the case of radiation-pressure instability (Czerny et al. 2009).
Upper limits to the length of the quiescent period [Myr].
The projections of the lobes in the sky plane also lie in the plane of the drawing in Fig. 1 but are not shown for clarity’s sake.
Both these figures have been corrected for 1/sinθ, where θ = 45°.
Acknowledgments
This research has made use of the NASA/IPAC Extragalactic Database (NED) which is operated by the Jet Propulsion Laboratory, California Institute of Technology, under contract with the National Aeronautics and Space Administration.
References
- Barthel, P. D. 1989, ApJ, 336, 606 [Google Scholar]
- Brocksopp, C., Kaiser, C. R., Schoenmakers, A. P., & de Bruyn, A. G. 2011, MNRAS, 410, 484 [NASA ADS] [CrossRef] [Google Scholar]
- Czerny, B., Siemiginowska, A., Janiuk, A., Nikiel-Wroczyński, B., & Stawarz, Ł. 2009, ApJ, 698, 840 [NASA ADS] [CrossRef] [Google Scholar]
- Fanaroff, B. L., & Riley, J. M. 1974, MNRAS, 167, 31P [Google Scholar]
- Garrington, S. T., Leahy, J. P., Conway, R. G., & Laing, R. A. 1988, Nature, 331, 147 [NASA ADS] [CrossRef] [Google Scholar]
- Gawroński, M. P., Marecki, A., Kunert-Bajraszewska, M., & Kus, A. J. 2006, A&A, 447, 63 [NASA ADS] [CrossRef] [EDP Sciences] [Google Scholar]
- Gopal-Krishna, & Wiita, P. J. 2000, A&A, 363, 507 [NASA ADS] [Google Scholar]
- Hatziminaoglou, E., Siemiginowska, A., & Elvis, M. 2001, ApJ, 547, 90 [NASA ADS] [CrossRef] [Google Scholar]
- Janiuk, A., Czerny, B., Siemiginowska, A., & Szczerba, R. 2004, ApJ, 602, 595 [NASA ADS] [CrossRef] [Google Scholar]
- Kaiser, C. R., & Cotter, G. 2002, MNRAS, 336, 649 [NASA ADS] [CrossRef] [Google Scholar]
- Kaiser, C. R., Schoenmakers, A. P., & Röttgering, H. J. A. 2000, MNRAS, 315, 381 [NASA ADS] [CrossRef] [Google Scholar]
- Komissarov, S. S., & Gubanov, A. G. 1994, A&A, 285, 27 [NASA ADS] [Google Scholar]
- Laing, R. A. 1988, Nature, 331, 149 [NASA ADS] [CrossRef] [Google Scholar]
- Lara, L., Cotton, W. D., Feretti, L., et al. 2001, A&A, 370, 409 [NASA ADS] [CrossRef] [EDP Sciences] [Google Scholar]
- Marecki, A., & Swoboda, B. 2011, A&A, 525, A6 [NASA ADS] [CrossRef] [EDP Sciences] [Google Scholar]
- Pirya, A., Nandi, S., Saikia, D. J., & Singh, M. 2011, Bull. Astron. Soc. India, 39, 547 [Google Scholar]
- Saikia, D. J., & Jamrozy, M. 2009, Bull. Astron. Soc. India, 37, 63 [NASA ADS] [Google Scholar]
- Schoenmakers, A. P., de Bruyn, A. G., Röttgering, H. J. A., & van der Laan, H. 2000, MNRAS, 315, 395 [NASA ADS] [CrossRef] [Google Scholar]
- van Breugel, W. J. M., & Willis, A. G. 1981, A&A, 96, 332 [NASA ADS] [Google Scholar]
- Zhao, J.-H., Burns, J. O., & Owen, F. N. 1989, AJ, 98, 64 [NASA ADS] [CrossRef] [Google Scholar]
All Tables
All Figures
|
Fig. 1 A schematic diagram of J1211+743. (Lengths and distances are not drawn to scale.) |
| In the text | |
Current usage metrics show cumulative count of Article Views (full-text article views including HTML views, PDF and ePub downloads, according to the available data) and Abstracts Views on Vision4Press platform.
Data correspond to usage on the plateform after 2015. The current usage metrics is available 48-96 hours after online publication and is updated daily on week days.
Initial download of the metrics may take a while.