Fig. 5
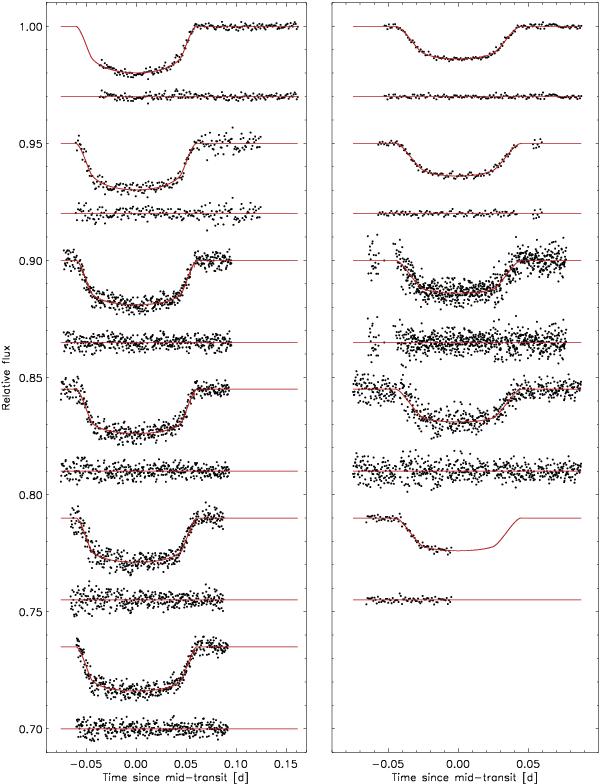
Follow-up photometry of WASP-42 (left) and WASP-49 (right) together with the respective model and residuals. Each light curve has been divided by the respective photometric baseline model as described in Sect. 3.2. The light curves of WASP-42 are (from top to bottom) EulerCam on March 20 and 25, 2011, and TRAPPIST on March 5, 10, 30 and April 4, 2011 (UT). The light curves of WASP-49 are (from top to bottom) EulerCam on January 19 and March 24, 2011, TRAPPIST on January 19 and 24 October 2011, and FTS on 21 March 2011 (UT).
Current usage metrics show cumulative count of Article Views (full-text article views including HTML views, PDF and ePub downloads, according to the available data) and Abstracts Views on Vision4Press platform.
Data correspond to usage on the plateform after 2015. The current usage metrics is available 48-96 hours after online publication and is updated daily on week days.
Initial download of the metrics may take a while.