Free Access
Fig. 2
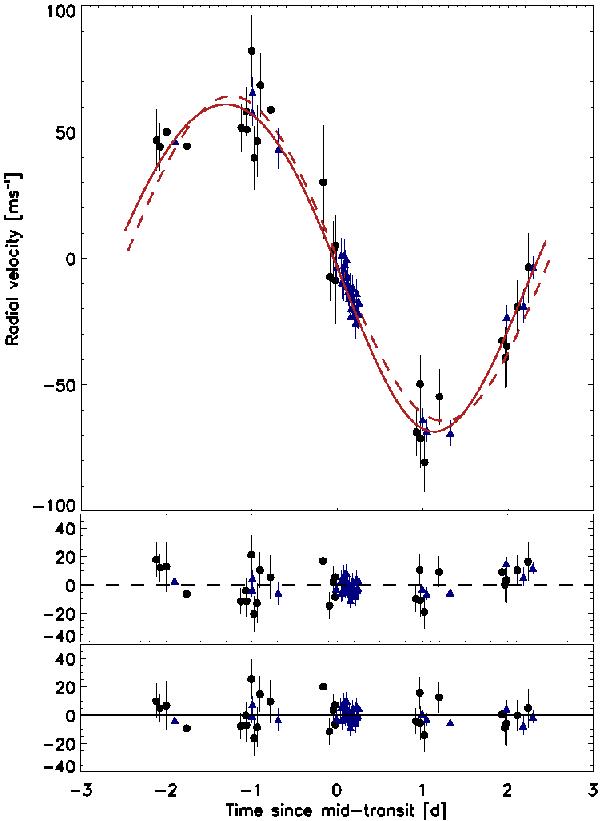
Upper panel: radial velocity observations of WASP-42 together with the circular (dashed line) and eccentric (solid line) models. Black dots denote CORALIE data, while blue triangles denote HARPS data. Middle panel: residuals of the circular model. Lower panel: residuals of the eccentric model.
Current usage metrics show cumulative count of Article Views (full-text article views including HTML views, PDF and ePub downloads, according to the available data) and Abstracts Views on Vision4Press platform.
Data correspond to usage on the plateform after 2015. The current usage metrics is available 48-96 hours after online publication and is updated daily on week days.
Initial download of the metrics may take a while.