Free Access
Fig. 3
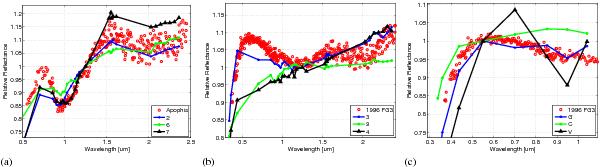
Classification in the G-mode taxonomical system for: a) (99 942) Apophis using G13 taxonomy; b) (175 706) 1996 FG3 using G13 taxonomy; and c) (175 706) 1996 FG3 using G9 taxonomy. All the spectra are normalized either to 1.25 μm (left and central panel), or to 0.55 μm (c)).
This figure is made of several images, please see below:
Current usage metrics show cumulative count of Article Views (full-text article views including HTML views, PDF and ePub downloads, according to the available data) and Abstracts Views on Vision4Press platform.
Data correspond to usage on the plateform after 2015. The current usage metrics is available 48-96 hours after online publication and is updated daily on week days.
Initial download of the metrics may take a while.