Fig. 4
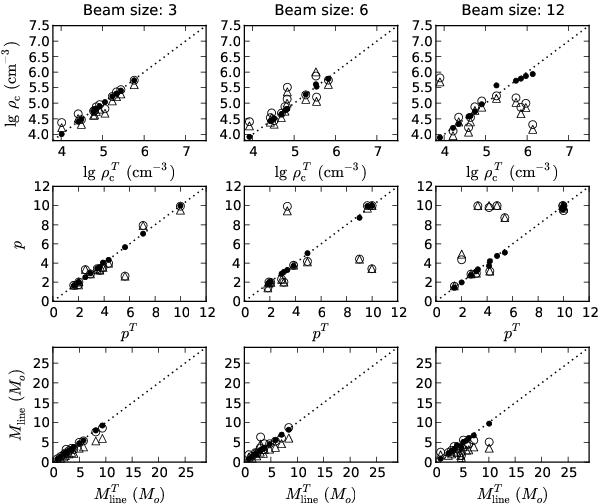
Comparison of the Plummer parameters derived from true column density and the values estimated from the synthetic maps of model A. The rows correspond to parameters ρc, p, and Mline. The columns correspond to beam sizes equal to 3, 6, and 12 pixels, i.e., to the near, medium and far cloud distances. On the x-axis, we always plot the parameter values from NTrue and on the y-axis the values from NObs derived with β = 2.0 and without observational noise (solid circles), with β = 2.0 and noise (open circles), and with β = 1.8 and noise (triangles).
Current usage metrics show cumulative count of Article Views (full-text article views including HTML views, PDF and ePub downloads, according to the available data) and Abstracts Views on Vision4Press platform.
Data correspond to usage on the plateform after 2015. The current usage metrics is available 48-96 hours after online publication and is updated daily on week days.
Initial download of the metrics may take a while.