Fig. 2
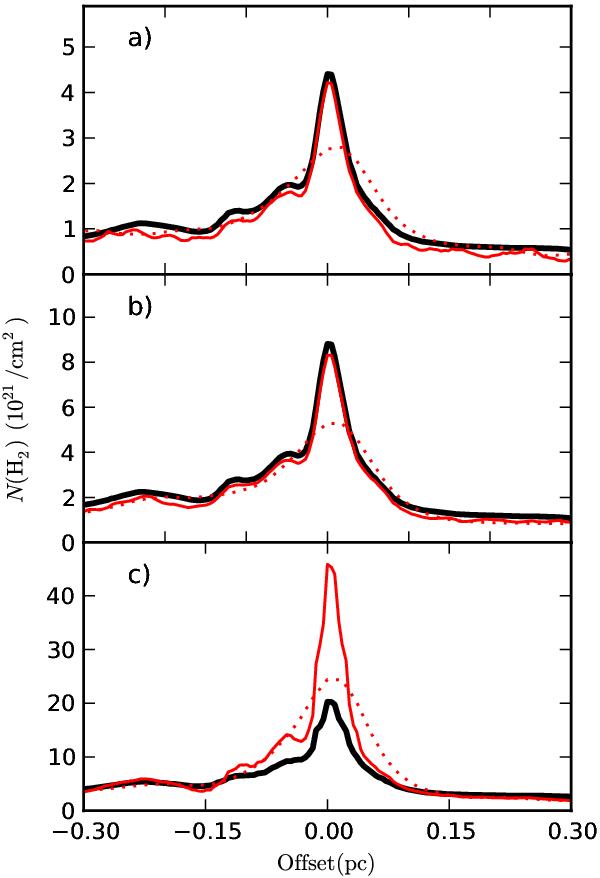
The profile of the filament number 1 as seen in the models A − C (frames a)–c), respectively). The solid thick line shows the actual column-density profile in the model cloud. The other curves show the profiles derived from the synthetic observations when the cloud is at a near distance of 93 pc (thin solid line) or 371 pc (dotted line).
Current usage metrics show cumulative count of Article Views (full-text article views including HTML views, PDF and ePub downloads, according to the available data) and Abstracts Views on Vision4Press platform.
Data correspond to usage on the plateform after 2015. The current usage metrics is available 48-96 hours after online publication and is updated daily on week days.
Initial download of the metrics may take a while.