Fig. 14
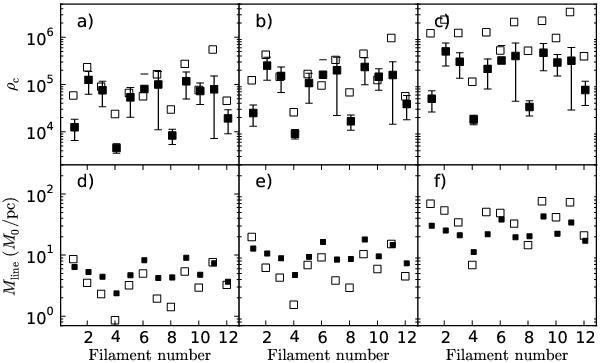
Comparison of the ρc and filament mass estimates from the Plummer fits (open symbols) and the actual values of maximum line-of-sight densities and masses in the cloud model (solid squares). The error bars on the true densities correspond to the 1σ dispersion of the peak density values along the filament. In the mass estimates the solid squares correspond to the total mass within a projected distance of 0.1 pc of the filament. Model A: frames a) and d), model B: frames b) and e), model C: frames c) and f).
Current usage metrics show cumulative count of Article Views (full-text article views including HTML views, PDF and ePub downloads, according to the available data) and Abstracts Views on Vision4Press platform.
Data correspond to usage on the plateform after 2015. The current usage metrics is available 48-96 hours after online publication and is updated daily on week days.
Initial download of the metrics may take a while.