Fig. 12
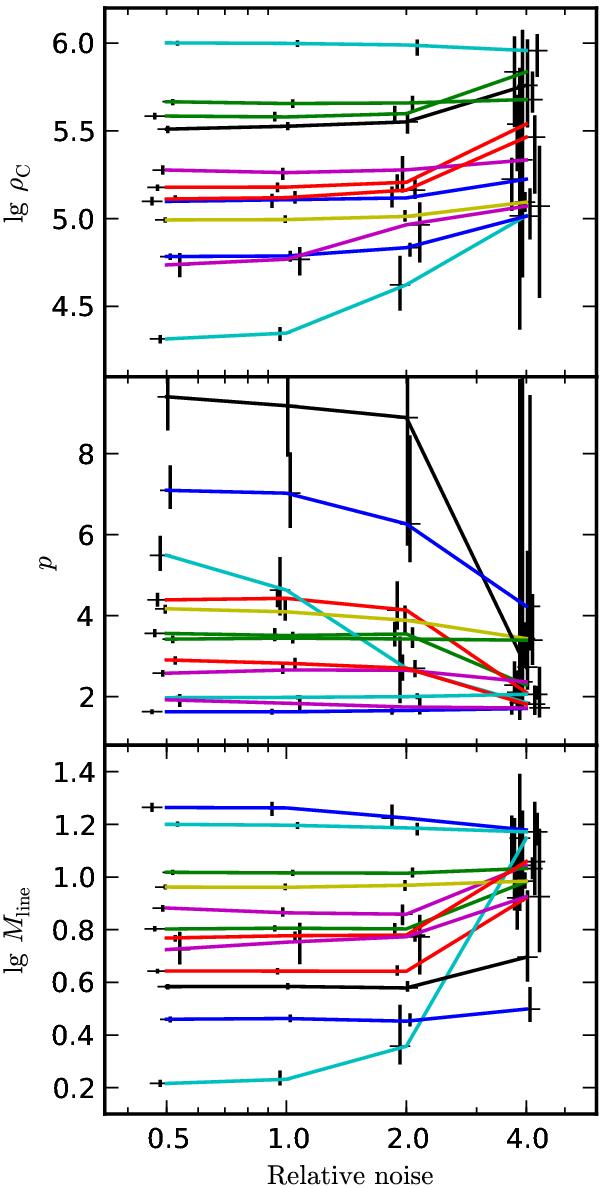
The dependence of the extracted Plummer parameters ρc, p, and Mline on the noise level in the case of model A and the near cloud distance. The level of instrumental noise is either 0.5, 1.0, 2.0, or 4.0 times the default value (see Sect. 2). The plot shows for all the twelve filaments the median values and, as vertical bars, the inter-quartile intervals of the estimated parameters that are obtained from 50 noise realisations of the surface brightness maps. The coloured lines connect the median values. The vertical bars plotted for the individual filaments are shifted slightly along the x axis to avoid overlap.
Current usage metrics show cumulative count of Article Views (full-text article views including HTML views, PDF and ePub downloads, according to the available data) and Abstracts Views on Vision4Press platform.
Data correspond to usage on the plateform after 2015. The current usage metrics is available 48-96 hours after online publication and is updated daily on week days.
Initial download of the metrics may take a while.