Fig. 11
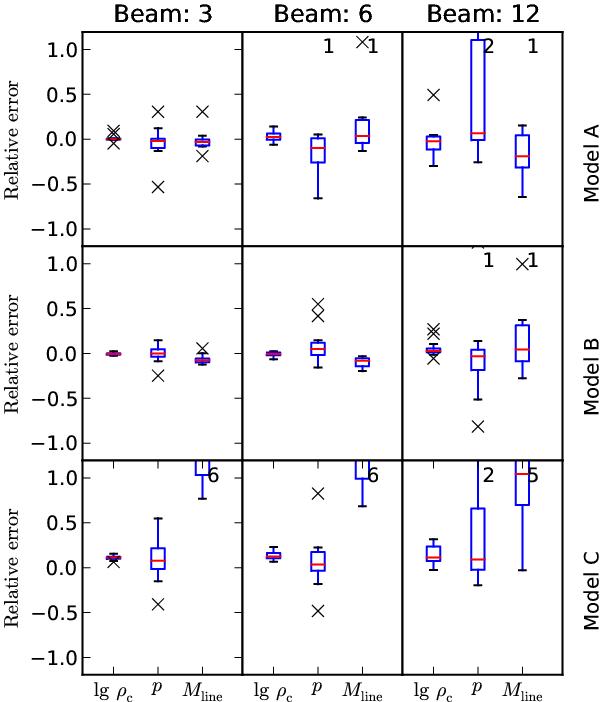
Boxplot for the relative errors in lg ρc, p, and Mline for the three cloud models and the three cloud distances (beam sizes of 3, 6, and 12 pixels corresponding to the near, medium, and far distances). The errors are calculated by comparing the values derived from NObs to those obtained from NTrue (see Figs. 4, 5, and 8). For each parameter, the box extends between the first and third quartile with a horizontal line indicating the median value. The vertical lines (whiskers) extend from the box to the last data point within a distance equal to 1.5 times the distance between the third and the first quartile. Points outside this range are drawn with crosses. The number of outliers falling outside the plotted range is indicated with numbers near the upper and lower borders.
Current usage metrics show cumulative count of Article Views (full-text article views including HTML views, PDF and ePub downloads, according to the available data) and Abstracts Views on Vision4Press platform.
Data correspond to usage on the plateform after 2015. The current usage metrics is available 48-96 hours after online publication and is updated daily on week days.
Initial download of the metrics may take a while.