Free Access
Fig. 1
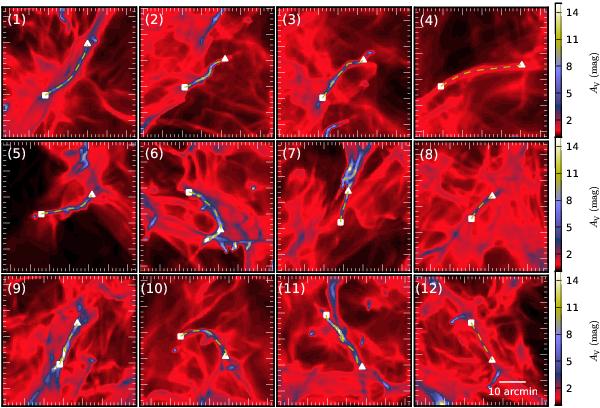
AV maps of the selected twelve filaments in model A. The dashed lines indicate the filament segments included in the analysis. The AV values are obtained directly from the model cloud where the 1000 × 1000 pixel image has been convolved with a beam of FWHM equal to three pixels.
Current usage metrics show cumulative count of Article Views (full-text article views including HTML views, PDF and ePub downloads, according to the available data) and Abstracts Views on Vision4Press platform.
Data correspond to usage on the plateform after 2015. The current usage metrics is available 48-96 hours after online publication and is updated daily on week days.
Initial download of the metrics may take a while.